RESEARCH ARTICLE
Layer Selection Method of Ultra-Short Radius Horizontal Wells
Erlong Yang1, 2, Huan Li3, *, Huijuan Gao1, Juquan Jia1, Meng Qi1
Article Information
Identifiers and Pagination:
Year: 2016Volume: 9
First Page: 169
Last Page: 177
Publisher Id: TOPEJ-9-169
DOI: 10.2174/1874834101609160169
Article History:
Received Date: 29/11/2015Revision Received Date: 18/01/2016
Acceptance Date: 06/06/2016
Electronic publication date: 26/08/2016
Collection year: 2016
open-access license: This is an open access article licensed under the terms of the Creative Commons Attribution-Non-Commercial 4.0 International Public License (CC BY-NC 4.0) (https://creativecommons.org/licenses/by-nc/4.0/legalcode), which permits unrestricted, non-commercial use, distribution and reproduction in any medium, provided the work is properly cited.
Abstract
Study on the technology that sidetracking horizontal wells with ultra-short radius to select boundary layer has certain practical meaning. But recently this kind of research, especially the study on sidetracking position for horizontal well, is less or even none. In this paper, on the basis of the potential superposition method and the equivalent flowing resistance method, the cumulative oil production calculation model of the horizontal well after sidetracking is established. Then the dimensionless height from the top is introduced to modify the model with the means of numerical simulation. Therefore set up the relationship between the cumulative oil production and six factors such as cumulative oil production, effective thickness, the dimensionless height from the top, average permeability, oil and water wells, the average remaining oil saturation and completeness of drilling stage for horizontal well. By combining break-even analysis, layer selection method of ultra-short radius horizontal wells is determined. A relevant chart is also obtained. The method established in this paper can help to choose the optimal layer of sidetracking horizontal well with ultra-short radius.
1. INTRODUCTION
Digging the side of sand body and the remaining oil in imperfect injection-production area through sidetracking the old well with ultra-short radius horizontal well has good advantage [1]. The target locations are mainly for low yield well, shutdown well, casing damage well and abandoned well, etc. But once these kinds of wells sidetracking, they will not be able to restore to use [2, 3]. Due to the high risk, the study of layer selection method of ultra-short radius horizontal wells is necessary.
Both in China and overseas, at present, researches on layer selection method of ultra-short radius horizontal wells are rare. To determine the layer selection method, it’s necessary to calculate side-tracking horizontal well productivity and development indicators. Scholars such as Borisov [4], Giger [5], Joshi [6] and Renard [7] have given the calculation methods in forecasting productivity in steady flow state, and Chinese scholars have predicted productivity of horizontal wells mostly based on stable or pseudo-steady flow. The productivity formula was mostly provided by analytical solution [8, 9]. The scholars had not systematically studied the prediction of horizontal well productivity in the non-steady-state flow. Researches on the productivity and indicators prediction of the horizontal wells with ultra-short radius are few.
In order to determine the layer selection method, productivity index and productivity prediction method for the ultra-short radius horizontal well need to be studied. Relationship between the cumulative oil production and the effective thickness, the dimensionless height from the top, the distance between oil wells and water wells, the average permeability, sidetrack drilling time (namely the average remaining oil saturation) and the degree of perfection in the recovery process of horizontal wells. By the potential superposition method and the equivalent flowing resistance method the oil production rate formula of different time and water breakthrough time for the production wells can be determined. Thus indirectly establish the relationship between the oil production and the effective thickness, the distance between oil wells and water wells, the average permeability, sidetrack drilling time (namely the average remaining oil saturation) and the degree of perfection in the recovery process of horizontal wells. But the mathematical model established through this method cannot reflect the relationship between the dimensionless distance top height and oil production, therefore the mathematical model need a further correction [10].
2. ESTABLISH THE MATHEMATICAL MODEL OF CUMULATIVE OIL PRODUCTION
The actual well pattern of the target oilfield is five spot. Fig. (1a) is the conventional five-spot pattern with vertical wells. Fig. (1b) is the network after the producing well is sidetracked. The horizontal section length is L.
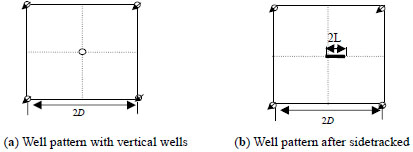 |
Fig. (1). Well spacing schematic before and after the producing well is sidetracked. |
2.1. Oil Production Speed of Vertical Producing Well
According to the principle of potential superposition, the well bottom potential of injection well and production well can be respectively obtained [11]:
 |
(1) |
 |
(2) |
Production fluid velocity for vertical well is as follow:
 |
(3) |
2.2. Oil Production Speed After Sidetracking
Flow within the pattern can be divided into three parts, namely the vertical part of horizontal well, the part between productive gallery and horizontal well and the part between external boundary and productive gallery [12]. By using the equivalent flowing resistance method, rate of oil production after sidetracking can be calculated as follow:
-
(1)
The initial oil production velocity

- (2) Oil production velocity before water breakthrough
Fig. (2) is the water content and its derivative.
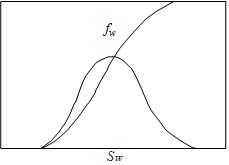 |
Fig. (2). Water content and its derivative [13]. |

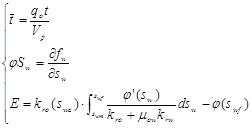
where,
-
(3)
Oil production velocity after water breakthrough

- (4) The time for water breakthrough
According to the cumulative water injection, the following equation can be established:

where,
 . When
 , water breakthrough happened.
So:

The cumulative oil production can be calculate as follow:

With this model the cumulative oil production of horizontal well under the conditions with different values of the effective thickness, the distance between oil wells and water wells, the average permeability, the average remaining oil saturation and the degree of perfection in the recovery process of horizontal wells can be calculated. The result is shown in Table 2 (correspond to the scenarios in Table 1). But this model cannot present the influence of the dimensionless height from the top on the cumulative production. So the numerical simulation method is need to be used for correction.
3. EFFECT OF DIMENSIONLESS HEIGHT FROM THE TOP ON 10-YEAR CUMULATIVE OIL PRODUCTION
By establishing numerical simulation conceptual model, the impact of the effective thickness, the dimensionless height from the top, the distance between oil wells and water wells, the average permeability, the average remaining oil saturation and the degree of perfection in the recovery process of horizontal wells on the 10-year cumulative oil production can be studied [14]. In this paper, the same numerical simulation model and the orthogonal design scenario were used to do the research.
| No. | Reservoir thickness (m) | Dimensionless height from the top | Distance between oil wells and water wells (m) | Average permeability (10-3um2) | Average remaining oil saturation | Degree of perfection in the recovery process of horizontal wells (%) |
|---|---|---|---|---|---|---|
| 1 | 2 | 0.125 | 150 | 150 | 0.40 | 0.00 |
| 2 | 2 | 0.250 | 200 | 250 | 0.45 | 25.00 |
| 3 | 2 | 0.375 | 250 | 400 | 0.50 | 50.00 |
| 4 | 2 | 0.500 | 300 | 600 | 0.55 | 75.00 |
| 5 | 2 | 0.625 | 350 | 800 | 0.60 | 100.00 |
| 6 | 3 | 0.125 | 200 | 400 | 0.55 | 100.00 |
| 7 | 3 | 0.250 | 250 | 600 | 0.60 | 0.00 |
| 8 | 3 | 0.375 | 300 | 800 | 0.40 | 25.00 |
| 9 | 3 | 0.500 | 350 | 150 | 0.45 | 50.00 |
| 10 | 3 | 0.625 | 150 | 250 | 0.50 | 75.00 |
| 11 | 4 | 0.125 | 250 | 800 | 0.45 | 75.00 |
| 12 | 4 | 0.250 | 300 | 150 | 0.50 | 100.00 |
| 13 | 4 | 0.375 | 350 | 250 | 0.55 | 0.00 |
| 14 | 4 | 0.500 | 150 | 400 | 0.60 | 25.00 |
| 15 | 4 | 0.625 | 200 | 600 | 0.40 | 50.00 |
| 16 | 5 | 0.125 | 300 | 250 | 0.60 | 50.00 |
| 17 | 5 | 0.250 | 350 | 400 | 0.40 | 75.00 |
| 18 | 5 | 0.375 | 150 | 600 | 0.45 | 100.00 |
| 19 | 5 | 0.500 | 200 | 800 | 0.50 | 0.00 |
| 20 | 5 | 0.625 | 250 | 150 | 0.55 | 25.00 |
| 21 | 6 | 0.125 | 350 | 600 | 0.50 | 25.00 |
| 22 | 6 | 0.250 | 150 | 800 | 0.55 | 50.00 |
| 23 | 6 | 0.375 | 200 | 150 | 0.60 | 75.00 |
| 24 | 6 | 0.500 | 250 | 250 | 0.40 | 100.00 |
| 25 | 6 | 0.625 | 300 | 400 | 0.45 | 0.00 |
| No. | Dimensionless height from the top | Numerical simulation result | Mathematic model result | Correction result |
|---|---|---|---|---|
| 1 | 0.125 | 828.48 | 166.20 | 898.34 |
| 2 | 0.25 | 1381.84 | 1023.66 | 1511.75 |
| 3 | 0.375 | 2203.19 | 1881.10 | 2125.14 |
| 4 | 0.5 | 2896.51 | 2534.68 | 2534.68 |
| 5 | 0.625 | 3551.83 | 3595.92 | 3351.88 |
| 6 | 0.125 | 3011.31 | 2489.04 | 3221.18 |
| 7 | 0.25 | 3637.13 | 3028.95 | 3517.05 |
| 8 | 0.375 | 1552.94 | 1438.85 | 1682.90 |
| 9 | 0.5 | 2506.64 | 2396.56 | 2396.56 |
| 10 | 0.625 | 1667.51 | 1631.60 | 1387.56 |
| 11 | 0.125 | 2659.07 | 2046.79 | 2778.93 |
| 12 | 0.25 | 3680.77 | 2904.59 | 3392.68 |
| 13 | 0.375 | 3893.64 | 3444.55 | 3688.59 |
| 14 | 0.5 | 2362.48 | 2816.15 | 2816.15 |
| 15 | 0.625 | 906.29 | 1189.38 | 945.33 |
| 16 | 0.125 | 4324.76 | 4052.49 | 4784.63 |
| 17 | 0.25 | 2669.59 | 2462.41 | 2950.50 |
| 18 | 0.375 | 2328.41 | 1797.32 | 2041.37 |
| 19 | 0.5 | 2337.24 | 2396.15 | 2396.15 |
| 20 | 0.625 | 2850.94 | 3195.03 | 2950.98 |
| 21 | 0.125 | 4212.54 | 3610.27 | 4342.41 |
| 22 | 0.25 | 3363.36 | 2945.18 | 3433.27 |
| 23 | 0.375 | 4203.06 | 3802.97 | 4047.02 |
| 24 | 0.5 | 2212.92 | 2163.49 | 2163.49 |
| 25 | 0.625 | 2498.76 | 2752.85 | 2508.81 |
On the foundation of five-point method for perfect vertical wells, the water flooding to the average remaining oil saturation in accordance with the scenario requirements was conducted (according to the reserve and recovery degree of the model). Then some or all of the water wells were closed, based on the degree of perfection of horizontal wells. Finally the 10-year cumulative oil production of horizontal wells can be predicted.
Table 2 shows the compared 10-year cumulative oil production calculated results of numerical simulation and mathematical model calculation. By comparing the results of numerical simulation and mathematical model calculation results, the dimensionless distance top height coefficient Hp is introduced. The revised formula is as follow:
 |
Correction result can be obtained according to the correction formula, as shown in Table 2. The average error is 6.68%, which meet the calculation precision (as shown in Fig. 3).
 |
Fig. (3). The numerical simulation result and the correction result. |
4. BREAK-EVEN ANALYSIS
Under the condition that logging investment, technology development costs, production costs of a ton of oil, crude oil commodity rate, oil prices, taxes, and other parameters were known, according to the input-output balance principle, the economic limit cumulative oil production was calculated as follows.
 |
When calculating the cumulative oil production under the control of economic limit: the drilling investment value Ch was 390,000 yuan/t; logging investment was 140,000 yuan/t; technology development cost was 250,000 yuan/t; the costs of logging and technology development Cfh was 390,000 yuan/t; the cost of a ton of oil Cp was 320yuan; oil price Po was 40$/bbl, namely 1844yuan/t; crude oil commodity rate Rc was 96%; evaluation period Γ was 10 years; the loan rate of investment R was 5.75%. According to the parameters mentioned above, the 10-years cumulative oil production after calculating was 582.73 tons.
5. LAYER SELECTION METHOD
As shown in Figs. (4-7). Combined with the 10-years cumulative oil production under the control of economic limit, the reasonable value range of the effective thickness, the distance between oil wells and water wells, the average remaining oil saturation, and the dimensionless height from the top can be determined, according to the formula of the cumulative oil production for horizontal wells with short radius.
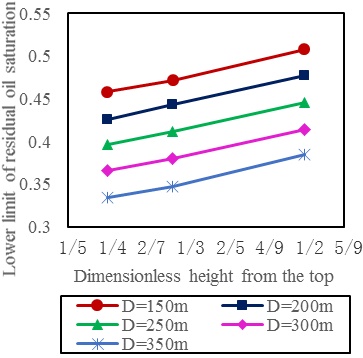 |
Fig. (4). The remaining oil saturation vs. different dimensionless height from the top and well spacing (effective thickness is 2m). |
With the sensitivity analysis, there existed a specific permeability value. When the average permeability was higher than the value, the reasonable value range of the corresponding effective thickness, remaining oil saturation, and well spacing will be slightly higher than that determined in the figure; And there existed a specific degree of perfection value. When the degree of perfection in the recovery process of horizontal wells was higher the value, the reasonable value range of these indicators should be slightly lower than that determined in the figure. While determining the reasonable value range of every indicator in this paper, the specific average permeability was regarded as 490 × 10-3μm2, and the specific degree of perfection in the recovery process of horizontal wells was regarded as 50%, namely there were two water injection wells.
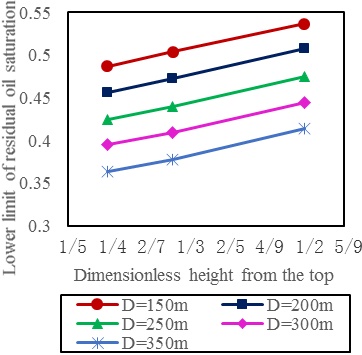 |
Fig. (5). The remaining oil saturation vs. different dimensionless height from the top and well spacing (effective thickness is 3m). |
From the figure we can obtain that when the dimensionless height from the top and the effective thickness were uniform, the average remaining oil saturation decrease with the distance between oil wells and water wells. While the dimensionless height from the top and the distance between oil wells and water wells were uniform, the average remaining oil saturation decrease with the increase of effective thickness. And when the distance between oil wells and water wells and the effective thickness were uniform, the average remaining oil saturation was smaller while the value of dimensionless height from the top was larger, which could allow side-tracking with short radius at larger distance from the top.
Steps to determine the layer for sidetracking are as follows:
Firstly, the value of the effective thickness, the distance between oil well and water well, the average permeability, the average remaining oil saturation and the degree of perfection in the recovery process should be collected for calculating. Secondly, the 10-year cumulative oil production can be calculated according to the formula (1), and the oil well with the largest 10-year cumulative oil production can be chosen as the direction for sidetracking. Then, the value of the distance between the oil well and water well, the effective thickness of reservoir and the average remaining oil saturation of this oil well should be determined. Finally, according to the figure, the sidetrack point, which meet the condition that the remaining oil saturation of this point is higher than that corresponding to the dimensionless height from the top of this point, can be determined. For example, while the distance between oil well and water well is 350m, the effective thickness is 4m, and the remaining oil saturation is between 0.35 and 0.383. According to Fig. (6), the dimensionless height from the top of the sidetrack point is 1/2.
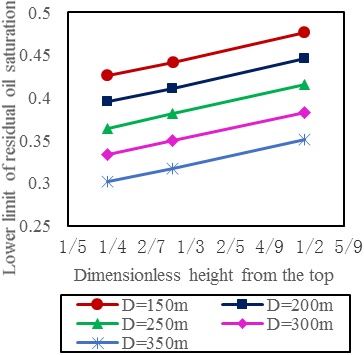 |
Fig. (6). The remaining oil saturation vs. different dimensionless height from the top and well spacing (effective thickness is 4m). |
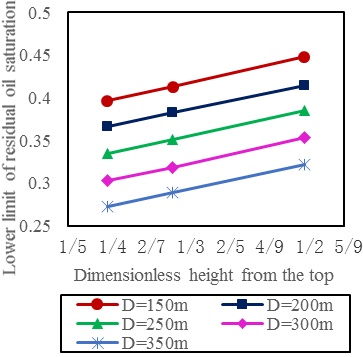 |
Fig. (7). The remaining oil saturation vs. different dimensionless height from the top and well spacing (effective thickness is 5m). |
CONCLUSION
The oil production prediction model is established, and the model’s calculation precision meet the requirements. The cumulative oil production after sidetracking with short radius horizontal well can be predicted with the parameters of the purpose well. Then the layer selection method of side-tracking horizontal wells with ultra-short radius can be determined by combining with break-even analysis.
LIST OF ABBERIVIATIONS
 |
= Dimensionless production time; |
| C | = Constant; |
| Cfh | = The costs of logging and technology development, million/well; |
| Ch | = The drilling cost, ten thousand yuan; |
| Cp | = The crude oil production and operating expenses, ten thousand yuan/t; |
| D | = The distance between oil well and water well, meter; |
| fw | = Water content, %; |
| h | = The effective thickness, meter; |
| j | = Number of injection wells; |
| KH | = Average permeability on horizontal direction, um2; |
| kro | = Relative permeability of water-phase, um2; |
| KZ | = Average permeability on vertical direction, um2; |
| L | = Horizontal section length, meter; |
| Po | = The crude oil prices after tax, ten thousand yuan/t; |
| q | = Oil production speed,ton/a; |
| Q | = The cumulative oil production, ton; |
| Qelim | = The cumulative oil production under the control of economic limit, ton; |
| R | = The loan rate of investment,%. |
| r0 | = Radius of water oil frontal, meter; |
| Rc | = The crude oil commodity rate, %; |
| rw | = Wellbore radius of injection well, meter; |
| Sw | = Water saturation; |
| Swc | = Irreducible water saturation; |
| Swf | = Water saturation of water oil frontal; |
| Swm | = Water saturation while x=0; |
| t | = Production time, a; |
| Vp | = Pore volume of the reservoir,m3; |
| ΔP | = Differential pressure of production,KPa; |
| μo | = Oil viscosity,mPa·s; |
| Φiwf | = The bottom potential of water injection wells; |
| Φwf | = The bottom potential of water production wells; |
CONFLICT OF INTEREST
The authors confirm that this article content has no conflict of interest.
ACKNOWLEDGEMENTS
The support of the key project of the National Natural Science Foundation of China for Youth (No. 51104030), Postdoctoral Science Foundation Project of China (No.2014M561325) and Postdoctoral Work Foundation Project of Beijing.


