RESEARCH ARTICLE
Production Forecasting of Coalbed Methane Wells Based on Type-2 Fuzzy Logic System
Lei Xu1, Kai Zhu2, Xiaoli Yang*, 3
Article Information
Identifiers and Pagination:
Year: 2016Volume: 9
First Page: 268
Last Page: 278
Publisher Id: TOPEJ-9-268
DOI: 10.2174/1874834101609010268
Article History:
Received Date: 12/03/2016Revision Received Date: 21/08/2016
Acceptance Date: 27/09/2016
Electronic publication date: 30/11/2016
Collection year: 2016
open-access license: This is an open access article licensed under the terms of the Creative Commons Attribution-Non-Commercial 4.0 International Public License (CC BY-NC 4.0) (https://creativecommons.org/licenses/by-nc/4.0/legalcode), which permits unrestricted, non-commercial use, distribution and reproduction in any medium, provided the work is properly cited.
Abstract
Coal bed methane (CBM) reservoir production is controlled by a large set of parameters: geology, tectonics, reservoir, completion and operation. Its simulation process is complicated, relative information is difficult to be obtained, so it is necessary to analyze accurately coal bed gas potential production capacity by adopting other mathematics methods in case of incomplete information. Regarding this problem, a new type-2 fuzzy logic system (T2FLS) method to predict CBM production capacity is proposed in this paper. Methods analyze and assess input parameters of T2FLS by integrating qualitative analysis method and quantitative assessment method (Fuzzy cluster analysis and grey correlation degree analysis). Output parameters include cumulative average gas production, peak gas rate and time to achieve a peak rate. T2FLS production forecast method is applied to CBM wells of Hancheng mine and verification results show that such prediction results are highly consistent with the variation of the CBM well production. The proposed method required less data. The comparison of this method with the existed method (ANN, T1FLS) shows that the proposed method has notable advantage in generalization, stability and consistency.
1. INTRODUCTION
At present, China is the largest consumer and producer of coal in the world and much attention has been focused on the production of CBM. As China had gradually expanded its investment in the development of CBM fields in the past few years, the number of drilling and producing wells has increased markedly. By 2020, China’s annual CBM production was expected to be 400×108m3 [1]. However, the goal will not be achieved without a substantial increase in CBM production in less developed basins, such as the Hancheng mining area, the largest mid rank CBM field in china. By the end of 2013, there were more than one thousand production wells, however, the total daily production was about 30×104 m3. Therefore, it is necessary to develop tools that can assist engineers in evaluation of CBM production prospects and overcome the lag to reach its true potential in production.
At present, the common methods of CBM production forecast include Arps decline curve method [2], numerical simulation method [3], artificial neural network (ANN) [4], type curve analysis [5] and Weng’s model [6]. Gas production form CBM reservoirs is different from regular oil-gas reservoirs: CBM reservoirs is governed by complex interaction of single-phase gas diffusion through micro-pore system and two-phase gas and water flow through cleat system that are coupled through desorption process. As a result, conventional methods, such as decline curves can not be utilized to predict CBM production.
CBM ground development is a systematic project; the quality of gas production rate is influenced by many factors. On the one hand, it is very difficult to get coal seam information or get information is not accurate because of its complex lithology, various reservoir types and heterogeneity. On the other hand, the development strategy of CBM is low-cost so many parameters are not available. Thus, it is tough to establish the uniqueness of the type curves because it needs to obtain the value of the peak gas rate, gas content, initial (maximum) water rate, cleat system porosity and initial cleat system water saturation. Currently, the best tool to predict CBM production is numerical models (simulators) since they incorporate the unique flow and storage characteristics of CBM reservoirs. But these models are often complicated to use, expensive, and time consuming. Therefore, there is a need for scientific, user-friendly tools that can assist the engineers in evaluation of CBM prospects.
To overcome the shortcomings of the earlier methods, researchers have utilized ANN and its variants. However, the problem of instability and uncertainties are still not being resolved yet. In fact, geosciences disciplines are not clear-cut and most of the time is associated with high level of uncertainties [7], and this is a major defect of exiting CBM production forecast methods. Type-2 fuzzy logic has been generally acknowledged as being better and ideal for uncertainty modeling [8-11]. Type-2 fuzzy logic, as an extension of Type-1 fuzzy logic, can handle such uncertainties in a better way because the membership grade for each element is no longer a crisp value but a fuzzy set, and there are more design parameters. It has since feature to handle uncertainties that caused by information loss such as information being incomplete, imprecise, fragmentary, not fully reliable, vague, contradictory or deficient [12-16]. Therefore, there is a possibility that the type-2 FLS can handle uncertainty in CBM well logs data as the type-2 fuzzy logic has been specifically invented to deal with.
Since CBM production is affected by various factors such as geology, tectonics, reservoir, completion and operation parameters, selection of the most appropriate input output turns to be a challenging task. As to the complicated nonlinear relation existing between these parameters, methods analyze and assess the input output parameters of T2FLS by integrating qualitative analysis method and quantitative assessment method (Fuzzy cluster analysis [17] and grey correlation degree analysis [18]) has been put forward. The goal of the input selection technology is to select inputs with most relevance to the outputs and with the least redundancy between inputs. Considering coal jam, proppant flowback, equipment failure and other factor's influence on the gas rate profile, we used the parameter of cumulative average gas production to weaken the uncertainty of the output. Based on the previous research results and actual situation, the output of the CBM fracturing effect are: cumulative average gas production rate, peak gas rate and time to peak gas. The proposed approach is implemented in Hancheng mining area in China, and the results show that the proposed method is feasible. The comparison of this method with the ANN, T1FLS shows that the proposed method has notable advantage in generalization, stability and consistency.
2. THEORIES OF TYPE-2 FUZZY LOGIC
2.1. Type-2 Fuzzy Logic
The concept of uncertainty that fuzzy logic was developed to tackle has been present for a long time. Zedeh first introduced type-2 fuzzy sets (T2FS) as an extension of an ordinary fuzz set which called type-1 fuzzy sets (T1FS) [19]. After that, lots of works have been carried out by other researchers [20-22]. A type-2 fuzzy set is characterized by a fuzzy membership function. The membership grade for each element is a fuzzy set in [0,1], unlike a type-1 set where the membership grade is a crisp number in [0,1]. Therefore, T2-FS can able to tackle uncertainty in a much better way, which make T2-FS ideal for productivity forecast.
A T2-FS, denoted as Ã, is characterized by a type-2 membership function μÃ(x,u) , where
 as follow:
 |
(1) |
Where Jx is called primary membership of x. A union set of primary membership is called footprints of uncertainty (FOU). As shown in Fig. (1), the shaded region is called FOU, and each represents the collective domain of the respective type-2 fuzzy set. Therefore, type-2 membership function belongs to three-dimensional function. Compared with type-1 membership function, it increases the degree of fuzzy set, and also the computation of union, intersection and complement [20].
In interval type-2 sets, the value of secondary grade is 1 [9], as follow:
 |
(2) |
Interval type-2 sets are the simplest kind of type-2 sets, and there are fast algorithms to compute the output. Therefore, it has practical value, and we will only relate to interval type-2 set.
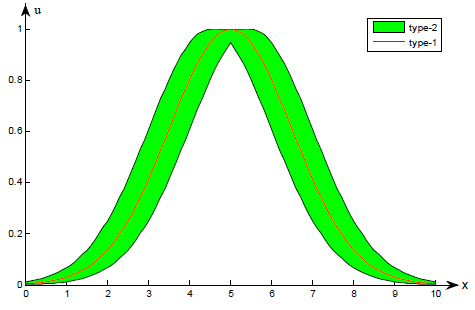 |
Fig. (1). Gaussian primary membership function with uncertain mean. |
2.2. Type-2 Fuzzy Logic Systems
As shown in Fig. (2) a type-2 fuzzy logic system contains five components: fuzzifier, rules, inference engine, type-reducer, and defuzzifier [15]. Type-2 fuzzy logic systems is similar to type-1 fuzzy logic systems expect the type-reducer. Based on type-2 fuzzy sets, T2FLS possess more tunable parameters.
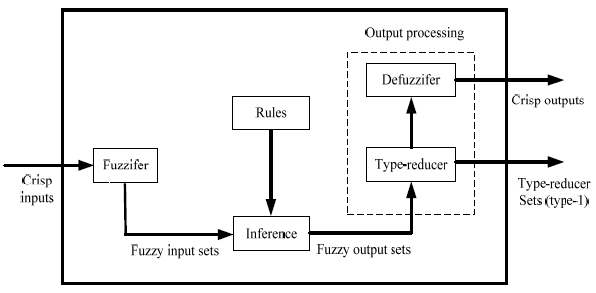 |
Fig. (2). Type-2 fuzzy logic system. |
A fuzzy logic system is a T2FLS in which at least one of the fuzzy sets used in the antecedent and/or consequent parts is a type-2 fuzzy set. Suppose that the rule base of a type-2 Mamdani FLS has M fuzzy rules, p inputs and one output, each of which has the following form:
 |
(3) |
where l=1, 2,…, M, Fl1 and Gl are type-2 fuzzy set. This rule represents a type-2 fuzzy relation between the input space, Χ1 ×…× Xp, and the output space, Y.
The reasoning process is finished by the extended sup-star composition, which include meet and join operation [15]. For each rule, after the operation, there will be a firing set, which transfer the uncertainty of the antecedent set to consequent set. For interval type-2 FLS, the firing set and consequent set
 are interval type-1 set. Once a crisp input x' is applied to the T2FLS, the interval firing strength of the lth rule can be obtained as:
 |
(4) |
Where
 and
and
 are the low and upper membership grades of firing set, respectively;
 (y) and
 (y) are the low and upper membership grades of consequent set, respectively; and * denotes product or minimum t-norm.
The results from the inference engine are type-2 fuzzy sets. The purpose of type reduction is to yield a type-1 set (type-reduced set) from the type-2 rule output sets. The key point is how to calculate the centroid of type -2 fuzzy set. At present, there are several kinds of type-reducer [15] such as height, center-of sums, center-of-sets (COS), etc. In this study, COS type-reducer method has been used because it provides reasonable computational complexity compared to other methods. The centroid of the output fuzzy set Ycos (x) can be expressed as:
 |
(5) |
Where yl and yr are upper and lower bounds of the reduced set. It must be noted that
 must be calculated before Ycos (x) has been calculated. In real application, and can be calculated using the Karnik-Mendel iterative algorithm [16], as follows:
 |
(6) |
The results from the type reduction are type- reduced set. Type- reduced set is an interval set which represented by [yl , yr]. A crisp output for T2FLS can be obtained by computing the cenrroid of the type- reduced set. Since all the memberships in YCos(x) are unity, its centroid is the mid-point of its domain.
2.3. Design of T2FLS
Given an input-output training pair (x(i): y(i)), we wish to design a T2FLS so that the error function is minimized:
 |
(7) |
Consider a T2FLS with Gaussian primary membership function with uncertain mean and interval secondary membership function. Using product t-norm COS type-reducer, average defuzzification. At this condition, the process to design T2FLS is to determine parameters including antecedent parameters mli1, mli2 and σli, consequent parameters yji and yjr.The steepest descent approach can be applied to obtain the following recursions to update all the design parameters above in order to minimize the error function:
 |
(8) |
where pjl(x) is fuzzy basis function associated with Yl .
 |
(9) |
Similarly,
 |
(10) |
 |
(10) |
 |
(11) |
 |
(12) |
where the value of j depend on the independent variable x relative to the position of the mean of left, right of Gaussian function.
3. INPUT AND OUTPUT SELECTION
The main factors which influence the production of coalbed methane can be divided into two kinds: uncontrollable and controllable. The uncontrollable parameters include geological, tectonics, reservoir and other original conditions. The controllable parameters include types of drilling, well completion, reservoir stimulation, depletion work system and so on.
For production wells, conventional well logs are the only data that is available to describe the formation situation and authors have developed many methods to identify CBM reservoir characteristic parameters based on well logs and got good effect [23]. Therefore, based on black box theory well logs can replace parameters such as porosity, permeability etc. In this article, we ignore the influence of structure, drilling and well completion methods on capacity try to establish the corresponding prediction model based on T2FLS using well logging, reservoir stimulation technology and production system as primary inputs parameters.
The input parameters considerably affect the model’s performance. Insufficient input parameters may leads to a model which is unable to simulate the dynamics of the system. On the other hand, substantial irrelevant variables and abundant parameters tend to degrade generalization. Therefore, adopting an appropriate input selection technique is of utmost importance in prediction applications. Correlation analysis, principal component analysis, regression analysis and variance analysis are commonly used techniques in the field of input selection [24]. However, these methods above are linear techniques which perform poorly when nonlinear relationships between input variables prevail. Fuzzy clustering allows the fuzziness of the nature of the data, and it can set up the description of the sample with the categories of uncertainty. Therefore, it can be used to data and classes with poor separation. The advantage of grey correlation degree analysis (GCDA) is that it requires only a lower amount of data and workload, and can largely reduce the losses caused by the information asymmetry. In this paper, we combine Fuzzy cluster analysis (FCA) and grey correlation degree analysis (GCDA) techniques to select appropriate inputs for CBM productivity forecasting.
3.1. Input Selection Algorithm
The goal of the input selection algorithms is to select a set of input variables with the highest relevance to the output and the least inter-dependence among each other. The dynamic variation characteristics of CBM are affected by many different factors, and there are equivalent or causal relationships between these factors. This article puts forward a qualitative and quantitative evaluation method to determine input variables. Controllability, relative independentability, operability and comprehensive are the principles that qualitative evaluation should followed. Then, 18 primary parameters were selected for investigation as shown in Table 1. At present, CBM wells mainly adopt active water fracturing fluid. However, the active water does not compatibility with formation and may cause permeability damage. It is commonly believed that the longer the fracturing fluid residue in formation the severer the formation damage is. Therefore, the parameter of interval time between fracture and production (ITBFP) is selected as a primary parameter.
| Parameter | Range | Parameter | Range | Parameter | Range |
|---|---|---|---|---|---|
| thickness of coal, m | 2-12 | burial depth, m | 384-1005 | well diameter, cm | 18-41 |
| natural gamma, API | 10.5-47 | SP, mv | -80-84 | acoustic, us/m | 240-467 |
| CNL, v/v | 22-60 | density, g/cm3 | 1-2.51 | LLD, Ώm | 150-18343 |
| LLS, Ώm | 56-17380 | RMSF, Ώm | 36-13507 | proppant volume, m3 | 7-51 |
| pad volume, m3 | 70-500 | total volume, m3 | 207-1003 | injection rate, m3/min | 4.5-8.5 |
| ITBFP, day | 11-431 | delivery rate, m/day | -6.8-17.2 | casing pressure, MPa | 0.01-2.7 |
We employ FCA and GCDA techniques to reduce the dimension of input vector. Further information about these techniques can be found in [25, 26]. The main steps are as follow:
- Using primary input factor parameters and sample data to establish the original data matrix.
- Normalize the original data matrix and establish fuzzy similar matrix using distance method.
- According to the fuzzy similar matrix, the transitive closure method is used to establish a fuzzy equivalence matrix.
- Let threshold λ vary from 1 to 0 and obtain the dynamic graphs of fuzzy cluster. The best threshold can be determined by expertise or F-statistics.
- According to the result of the classification of the step (4), GCA method is employed to calculate the grey correction degree of each class which includes more than two factors.
3.2. Output Selection
As an unconventional gas resource, the most obvious difference between CBM and conventional gas is in the gas storage mechanism. For CBM reservoir, the gas mainly stored at liquid densities on the surface matrix of coal by physical sorption. In order to produce gas, it must first be desorbed form the coal. Since most CBM reservoirs are often 100% water saturated, it needs water to be produced to depressurize the coal. Wells go through a period of increasing gas rate as the coal is dewatered. The dewatering period last from weeks to years depend on initial reservoir pressure, critical desorption pressure, permeability and pump capacity etc. The period between the onsets of production to the peak gas rate is referred to as “time to peak gas”. Accordingly, the gas rate is referred to as “peak gas rate”.
From the perspective of the seepage mechanics and cybernetics, system of coal bed belongs to the distributed parameter systems. Reservoir pressure, the scope of the pressure drop and permeability are the most fundamental physical quantities which describe the state of coal bed, but obtain those parameters is difficult. Therefore engineers commonly use formation pressure, gas and water production rate, recovery degree, and cumulative gas and water production to reflect the development dynamic conditions of CBM.
Due to the gas production rate is an instantaneous value, using black-box method (fuzzy logic, ANN) to model the gas rate profile is a hard test. In order to establish the sample database, it is needs to statistical data of different time from the historical data, but this is time consuming. Furthermore, the value of cumulative gas and water production is big and the differences between different wells are often significant which have great influence on the generalization of the model. To overcome the shortcomings, researchers have utilized exponential function and its variants.
The production profile form each of the reservoirs used to train the network were fit to an exponential function of time are given in Srinivasan [3]:
 |
(13) |
where the coefficients a, b, c and d were calculated with neural network method.
Weng’s model describes the things from the rise, growth, maturity to the whole process of recession, which is similar to the process of CBM development [6]. That is,
 |
(14) |
where parameters a, b and c can be calculated by linear regression using the early stage of the production well data.
The above methods are derived from typical gas rate profile for a CBM well. However, in the process of really production, due to coal jam, proppant flowback, equipment failure and other factors, the gas rate profile is irregular see Fig. (3). Similar to Grey theory, the times accumulated values are more and more regular for a series of irregular data. As shown in Fig. (3), no matter how irregular the actual gas production profile is, the cumulative average gas production profile is relatively stable.
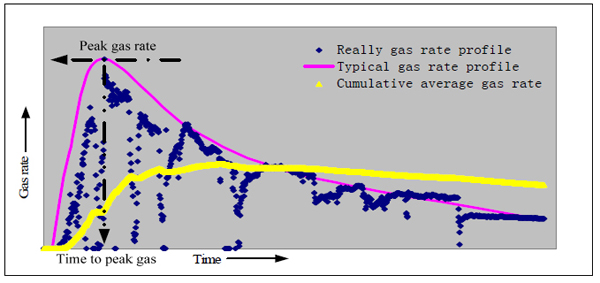 |
Fig. (3). Gas production profile. |
Thus, based on the previous research results and actual situation, the output of the CBM fracturing effect are: cumulative average gas production rate (CAGR) for a period of time, peak gas rate and time to peak gas.
4. APPLICATION
In order to carry out an empirical study, real-industrial data from Hancheng mining area were acquired. The number of 3#, 5# and 11# are the main coal seams in Hancheng mining area. Those coal seams buried depth from 400 m to 1 000 m, formation pressure coefficient from 0.6 to 0.8, single layer thickness of 1.5 m to 10 m, permeability of 0.01×10⁻³-2.50×10⁻³ μm2, porosity of 1.5%-8.0% and gas content of 3.51-14.13 m3/t. With characteristics of low pressure, low permeability and high gas content. The entire data was divided into three groups (60% for training, 20% for validation and 20% for testing). All data were normalized by equation (15) before training. Mean relative error (MRE) was used to evaluate prediction accuracy, which is as follows:
 |
(15) |
where
 and y(i) represent the actual and prediction values, respectively, N is the number of predicting points.
 |
(16) |
According to input selection algorithm in Section 3.2, the factors influencing the peak gas flow rate is presented in Table 2. There are also fourteen factors influencing the cumulative average gas production rate for a period of time and time to achieve peak gas.
| Parameter categories | Names of parameters |
|---|---|
| Reservoir | Thickness of coal, burial depth, GA, LLD, AC, SP, well diameter |
| Fracturing | pad volume,total volume, proppant volume, injection rate |
| Drainage | ITBFP, casing pressure, delivery rate |
| Output | MRE (%) | Correlation coefficient |
|---|---|---|
| Peak gas rate | 0.112 | 0.85 |
| Time to achieve a peak rate | 0.164 | 0.87 |
| CAGR for a period of days | 0.128 | 0.92 |
In this paper, antecedent and consequent adopt the Gaussian membership function with uncertain mean as membership function. The number of the rules is determined by numerical experiments with Matlab software. Design parameters include antecedent parameters
 and
and
 , parameters
 and
and
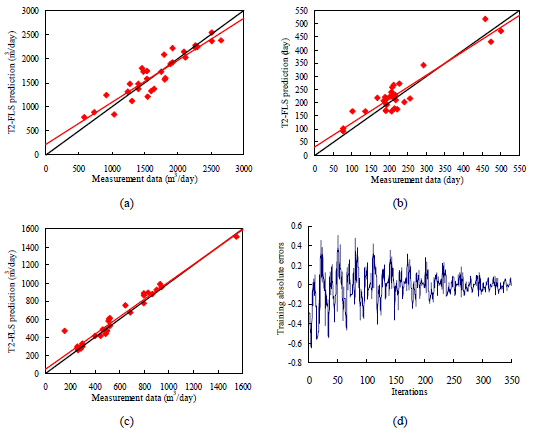
 are randomly selected form 0 to 1. Then steepest descent approach is applied to update all the design parameters above in order to minimize the error function. After the T2FLS model had been trained and validated, it was used to predict output. Take output of peak gas rate for example, the minimum absolute error will be got at the 11 cycle as shown in Fig. (4d). It will be over-trained after that point. So iteration time will be set 330 to get the best T2FLS structure. Meanwhile, at least 3 wells data results in some degree information loss because that there are 3 obvious peaks at every iteration cycle. The correlation between the measurement data and the estimated value are shown in Fig. (4a-c). The black line represents the equation of “y=x”, and the red line represents the prediction result. In addition, the MRE and correlation coefficient for different output are also listed in Table 3. Most of the values of the T2FLS prediction are located on a line of unit slop, which shows a good agreement with the measured data.
4.1. Case Analysis
In order to validate the T2FLS method, T1FLS and artificial neural network (ANN) have also being used to predict the CBM production. A comparison of prediction results of the CBM production among the T1-FIS, ANN, and T2FLS is shown in Fig. (5). In addition, the MRE, mean absolute error and minimum error for different approaches are also listed in Table 4. In light of paper space only top performance sets are shown here. The predicted results indicate that the T2FLS based model shows better accuracy and generalization ability than the ANN, and T2FLS models. The value of minimum error is of ANN very small, but the prediction accuracy is relatively low and the results predicted with this method do not well reflect the production fluctuation. This further indicates that the T2FLS is able to deal with uncertainties inherent in the nature of reservoir data, and have relatively better stability and consistency which are very crucial in any predictive model.
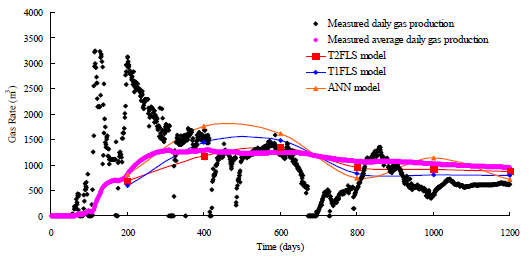 |
Fig. (5). Comparison of prediction results among T1-FIS, ANN, and T2FLS. |
| Models | MRE (%) | Mean Absolute Error (m3) | Minimum Error (m3) |
|---|---|---|---|
| T2FLS | 0.104 | 108.1052 | 84.906 |
| T1FLS | 0.194 | 201.4924 | 157.6512 |
| ANN | 0.222 | 254.0767 | 14.71408 |
CONCLUSION
This paper has proposed a sophisticated CBM production forecasting approach based on the FCA and GCDA-based input selection algorithm and T2FLS model. The effectiveness of the proposed method is demonstrated using field data obtained from Hancheng mining area. These data include well logs, fracturing treatment data and production data. In order to reduce the output fluctuation caused by discontinuous production, output parameters such as peak gas flow rate, time to achieve a peak rate and average gas flow rate are used to depict the performance of CBM wells. FCA and GCDA techniques are used here to select a set of input variables with the highest relevance to the output and the least inter-dependence among each other. A comparison of measured data with estimated results shows that the T2FLS based CBM production forecasting model is reliable and effective. It can reflect the dynamic characteristics of CBM at the development stage, and can provide important technical support for making and establishing scientific schemes of development programming for CBM. A comparison of estimated output of the CBM production among the T1FIS, ANN, and T2FLS shows that the T2FLS have relatively better stability and consistency than that of ANN and T1FIS methods.
CONFLICT OF INTEREST
The authors confirm that this article content has no conflict of interest.
ACKNOWLEDGEMENTS
This study was supported by National Science and Technology Major Project of Large Oil and Gas Fields and Coalbed Methane Development (2011ZX05062-008).


