RESEARCH ARTICLE
Shale Reservoir-Centric Completions
John S. Spaid1, Jeff A. Dahl1, Ronald G. Dusterhoft2, Shameem Siddiqui3, Eric Holderby*, 4, Buddy McDaniel5
Article Information
Identifiers and Pagination:
Year: 2016Volume: 9
Issue: Suppl-1, M6
First Page: 92
Last Page: 106
Publisher Id: TOPEJ-9-92
DOI: 10.2174/1874834101609010092
Article History:
Received Date: 12/2/2015Revision Received Date: 21/5/2015
Acceptance Date: 12/08/2015
Electronic publication date: 30/06/2016
Collection year: 2016
open-access license: This is an open access article licensed under the terms of the Creative Commons Attribution-Non-Commercial 4.0 International Public License (CC BY-NC 4.0) (https://creativecommons.org/licenses/by-nc/4.0/legalcode), which permits unrestricted, non-commercial use, distribution and reproduction in any medium, provided the work is properly cited.
Abstract
In North America, the transition from more conventional reservoirs into tight, basin-centered gas and now source shales has caused the industry to change the way reservoir performance is being assessed, measured, and documented. Historically in conventional reservoirs the reservoir quality was carefully examined on a well by well basis to determine reserves in place and exploitation plans. For unconventional reservoirs, however, the commercializing of such plays quickly became centered on horizontal drilling of long laterals combined with massive volume, high rate multi-stage hydraulic fracturing. In that environment, completion design and hydraulic fracturing have become more of a statistical process; additionally, incremental improvement and innovation are used to create a treatment schedule often replicated across an entire field without consideration of reservoir variability across a lateral. Based upon vertical well experience, the fracture initiation points can be carefully selected by identifying the locations within the well that are best to perforate. In a horizontal well, however, the location of the lateral defines the fracture initiation points anywhere along the well, so the stratigraphic location of the well lateral becomes critical in non-homogeneous shale plays. To address this, engineers and geoscientists can identify important parameters necessary for optimum completion design, and earth modelling can then be used as a tool to capture and model these properties across the asset making critical information available as needed for drilling, completion, and production operations.
INTRODUCTION
In North America, the transition from more conventional reservoirs into tight, basin-centered gas and now source shales (simply referred to as shale or shale plays herein) has caused the industry to change the way reservoir performance is being assessed, measured, and documented. In conventional reservoirs, where vertical wells were the norm, the reservoir quality was carefully examined on a well by well basis to determine reserves in place and optimum drilling and completion designs. For unconventional reservoirs, however, the commercializing of such plays quickly became centered on horizontal drilling of long laterals combined with massive volume, high rate multi-stage hydraulic fracturing. The marginal economics and large areal extent of these reservoirs created something that has been referred to as a statistical play or a resource play. Here the basic assumption has been made that reservoir quality is relatively consistent and poor; this means that a large number of wells would be required in a development and that statistical variation of well performance is an acceptable result. The focus here takes the form of a well “factory approach” where the emphasis is placed on operational efficiency, reducing drilling and completion costs as much as possible to improve the marginal economics in this environment. Variation in well productivity becomes tolerable, provided economics are sustainable. In North America shale and unconventional reservoir development most of the advances made in optimized well performance came about through trial and error methodology in development of most plays. Additionally, many wells were drilled solely for the purpose of holding leased areas. Together these two aspects allowed marginal or unsuccessful wells and completion approaches to easily get “lost” in the large volume of activity occurring in many of the shale play startup periods of the mid- to late 2000s. Generally unsuccessful results were absorbed by the booming economics of the market at that time. Data mining within applications of a single play was one of the earlier approaches used to suggest improvements to stimulation processes or mechanical completion design decisions (Coulter et al. [1] and Grieser et al. [2]). As data bases grew, so did the scope of data mining reviews to provide insight on what not to do or geographical areas to avoid (Shelley et al. [3] and Centurion [4]), as opposed to current methodology focused on reservoir understanding which is geared much more at what to do for specific areas within a single play or even the acreage holdings of a single operator.
In statistical resource development, conventional means of data acquisition, such as openhole logs on every well and occasional coring was more practical for vertical wells. In fact, during the exploratory stages a well could even be abandoned without ever setting pipe. As the factory approach to horizontal drilling does not offer a wellbore that penetrates all the potential producing zones the normal well does not allow a view of the whole zone. Even during exploratory stages, with horizontal completions this data potential is often eliminated to reduce cost and expedite operations. In vertical or deviated wells targeting tight gas sand lenses without open hole logs, cased hole gamma ray is used to identify zones and verify intervals to be completed. While, in horizontal shale applications, the higher level of everyday science would only use very basic geosteering utilizing LWD Gamma for lateral placement without an understanding of the entire zone. This simplification is commonly followed by a “geometric” perforating and completion with equally spaced fractures along the entire horizontal lateral. The combination of these two strategies will often result in less than ideal lateral placement within the reservoir and a perforating strategy that is not based on localized formation conditions instead of accounting for the possibility of reservoir heterogeneity. The combination of these two simplifications will often result in very few wells that are optimized for the large investment each well represents. Only a few of the major plays presently being commercialized offer distinct, easily identified zones for lateral placement, or the limited heterogeneity appropriate for geometric perforating/completion plans.
In the statistical play approach, simple relationships such as production versus proppant placed per foot of pay or lateral length are often used to compare well performance results and optimize completion designs. Other examples may include the volume of fluid injected per foot of pay or lateral length versus well productivity. While these relationships may provide useful information, the statistical play approach makes it impossible to relate anything to well placement or reservoir quality, an area where work and research is now being conducted for some of these unconventional reservoirs.
A good example of such a review method was completed by Shelley et al. [5] in which over 1000 frac stages with microseismic data were analyzed in an attempt to determine relationships between observed fracture growth response and frac treatment design. After an exhaustive analysis of all pumping and microseismic data only very general observations could be made that can be summarized as follows:
- Stimulated Reservoir Volume (SRV) as determined from microseismic data was directly related to the frac treatment volume.
- Large volume treatments in long intervals pumped at high injection rates resulted in the highest SRV and fracture network widths.
- Frac treatments with the largest SRV’s and fracture network widths had neutral fracturing pressure trends.
- Frac treatment pressure response appears to be related to geographic location, proppant concentration, proppant size and treatment volume.
- Mapping of hydraulic fracture induced microseismic events appears to be more of a quantitative tool to estimate fracture geometry.
As good as this analysis was, and given the fact that it was considered to be a very rich data set due to the abundance of microseismic results that were used, it becomes apparent that the observation regarding geographic location is probably very much related to local reservoir quality and variation over a significantly large region. Because of very limited reservoir data available, local reservoir quality could not be factored into this analysis, severely limiting the usefulness of the results.
For shale developments, well performance and asset value has shifted from detailed reservoir characterization to the use of simple decline curve type analysis to establish recoverable reserves and asset value. Essentially, initial (early period) well performance has become a primary tool for establishing life of well predictions. The problem here is that the basic assumption about statistical equivalence from one well to the next is often wrong. In many cases, there is significant reservoir heterogeneity from one well to the next and often, from one productive interval to the next, meaning that not taking time to understand reservoir quality can result in large stimulation treatments being pumped into reservoir sections with no potential of ever paying out. The result is increased well cost without a corresponding production increase response. Essentially, it is exactly the opposite of what was intended.
Another unintended result of statistical approaches to field development is that a certain number of failures are required to establish boundaries. These wells can add a significant cost to a project without generating adequate production or sustainable economics. When the primary reason was incorrect placement of the lateral, this is seldom understood, so the “data point” will not truly be useful. Many companies previously utilized the approach of volume of work trumps quality of results and the market conditions at the time allowed for this trial and error work method to move towards some level of optimization after a large magnitude of work was performed. As larger data bases became available in many of the earlier plays, many such reviews produced very generic results with very limited value. Such reviews often have been limited by the broad differences in quality of product variations, most especially with extensive use of low- and even very low quality sands, brought to the marketplace due to both lower cost and by limited availability of better products. This quality control (QC) variable, as well as others that seem to have had widespread application, are variables that data mining is generally unable to capture, and many observed trends can easily be corrupted. The reality of QC problems apparently even has extended to ceramic proppant supply, as reported by Pearson et al. [6].
In vertical well tight gas applications, Schubarth et al. [7] demonstrated that taking the time and effort to run openhole logs to high grade quality gas sands and eliminate stages in low quality intervals could have great impact on production economics by eliminating unnecessary expenses and focusing on improving completion designs in the higher quality reservoir sections. The approach of being able to improve the usefulness of well logs was extensively discussed by Barree et al. [8] and a recent example of such an application in the Cardium shale in Canada was given by Hards et al. [9]. As shale play laterals also will often encounter significant heterogeneity, the Schubarth analysis is often parallel to what we encounter in horizontals as in the Barree et al. and the Hards et al. references just given. Fig. (1) shows a comparison of results in this study using statistical completion techniques perforating all sands based upon cased hole gamma ray logs with effectiveness of a more reservoir centric approach using openhole logs to high grade perforation locations and targeting higher quality sands. The Reservoir Centric approach essentially doubled the value of the well.
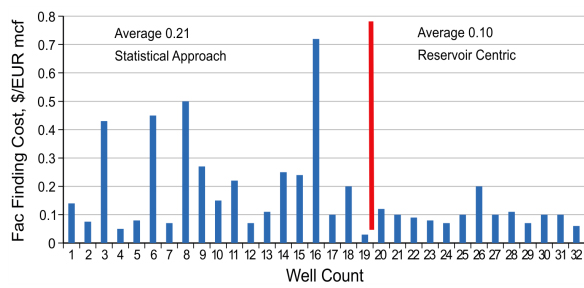 |
Fig. (1). Results of a tight gas study comparing results of statistical methods versus a reservoir centric approach [7]. |
In conventional tight oil or gas reservoirs, most of the wells traditionally have been either vertical or deviated, making it relatively easy and cost effective to perform openhole logging or create high quality pseudo open hole logs by applying neural network technology using cased hole logging, trained by regional open hole logs to capture reservoir information in the near-wellbore area. In shale plays, however, the vast majority of the wellbores drilled during a development will be horizontal, making it much more difficult and costly to obtain openhole log information and also very difficult to effectively interpret this information when it is available. The reservoir quality indicators for shale reservoirs are also significantly different from conventional reservoirs. In fact, a very strong case can be made suggesting that the reservoir quality indicators for shale will vary significantly from one field to the next, and even from one portion of a reservoir to another; this is attributed to variations in thermal maturity, reservoir fluid properties, total organic content (TOC), effective porosity, pore pressure, mechanical properties, and stresses. Because of this, shale assets tend to be much more complex in nature and achieving the greatest impact in economic performance requires a much more in-depth understanding of the reservoir. In these assets, the creation of an integrated subsurface model creates an environment for collaboration between geoscientists and engineers, and enables the use of forward looking engineering tools to model and anticipate well and field behavior using engineering tools and predictive techniques.
The Use of Earth Modeling in Shale Assets
In these unconventional resource shale reservoirs, the initial industry belief was that they would be large homogeneous reservoirs that could be treated as a resource or statistical play with little, if any, variation from one well to the next. From an engineering perspective, this meant that wells could be easily drilled and completed following a standard well template, making drilling cost and efficiency the key operational drivers. After several years of deploying this approach, it became apparent that there was much more variation in well performance than expected, including a large number of underperforming wells. Some other key driver was being missed!
More recent studies of these reservoirs at pore scale have revealed that the flow and production mechanisms can be extremely complex and, in many cases, the reservoirs were much more heterogeneous than first thought. It has taken several years, but reservoir understanding of shale has begun to catch up to engineering abilities to drill and complete horizontal wells with multistage hydraulic fracturing. Additionally, the importance of collecting key data to help construct detailed subsurface models is becoming more recognized and therefore more commonly obtained.
Earth modeling provides a means for integrating several key geoscience disciplines into a single environment to provide a detailed subsurface model that can be used to help make several key decisions:
- Identification of higher quality reservoir sections or sweet spots.
- Identification of larger scale geo hazards, such as faults and surfaces.
- Identification of smaller, sub-seismic hazards, such as clay-rich ductile layers that can introduce drilling and completion difficulties.
- Presence, density, and preferential directions of natural fracture systems.
- Mapping of key reservoir attributes, including TOC, effective porosity, mechanical properties, and preferential stresses.
- Presence, density, and preferential directions of natural fracture systems.
Most shale reservoirs that have been commercialized are source rocks or self-sourced reservoirs, meaning that the hydrocarbons that are still present within these reservoirs were generated from organic materials within the rock when exposed to time, temperature, and pressure. Understanding the burial history of these rocks is critical to determining how much hydrocarbon has been generated, how much has migrated out of the interval, how much hydrocarbon is still within the reservoir and the state, pressure and mobility of the hydrocarbon that is left in the reservoir. Detailed petroleum systems analysis and source rock modeling can be used to create larger basin models to help gain regional understanding of the production potential of a source rock as well as the hydrocarbon and state of the hydrocarbon still in place.
3D Seismic has been used extensively in the petroleum industry as an exploration tool to identify conventional reservoir traps and in many cases the hydrocarbon source rocks associated with these reservoirs. In many of the unconventional assets being developed today, conventional reservoirs were originally sourced by these formations, meaning that there is a relatively good understanding of where these source rocks are located. As we move to newer and less developed areas, however, seismic data may be used for true exploration type purposes to identify new source rock reservoir opportunities. For many of the current developments, seismic still plays a critical role in being the integration tool to populate reservoir properties, mechanical properties, stress, natural fractures and surfaces over a relatively large region helping to fill in the spaces between wellbores with the best possible information.
Local tuning of the understanding gained from the data base can then be accomplished using core analysis, geochemistry, and petrophysical interpretation. This will often require some knowledge upgrading from wells to be drilled where pre-existing wells with the required information and core might not already exist. Some key parameters that are obtained during this phase of the analysis include:
- Mineralogy.
- Total Organic Content (TOC).
- Maturity.
- Mechanical rock properties, including Poisson’s Ratio, Young’s modulus, and brittleness.
- Brinell hardness.
- Effective porosity.
- Water saturation.
- Estimation of the hydrocarbon in place.
- Estimation of the state of the hydrocarbon in place, whether gas, wet gas, condensate, or oil.
This article emphasizes the importance of integrating formation data and its analysis beyond what has been normal practice, and to illustrate the value and rewards this can bring. Once the above data generation has been accomplished, if there is not an adequate density of older vertical wells with useful log data (as is most common for shale plays) then 3D seismic is needed. The entirety of data can be used to map surfaces and, along with geostatistics, integrate properties between the wells to create a detailed geocellular subsurface earth model. At this stage, this model can be quite coarse because of scarce or sparse data; however, it is still the most comprehensive concentration of information available in addition to a collaboration hub to help direct the key decisions mentioned previously. Dusterhoft et al. [10] provide an outline of a basic procedure that has been summarized in Figs. (2a-c).
Once the initial subsurface earth model has been created, it enables several engineering workflows to improve placement of both the well’s surface location and the lateral itself, completion design, and completion optimization. An example workflow schematic described by Dahl et al. [11] is shown in Fig. (3).
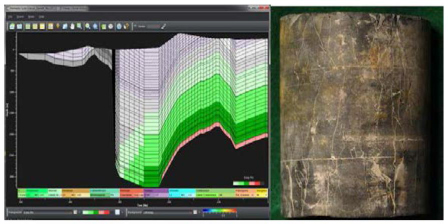 |
Fig. (2a). Petroleum systems analysis, core analysis and geochemistry. |
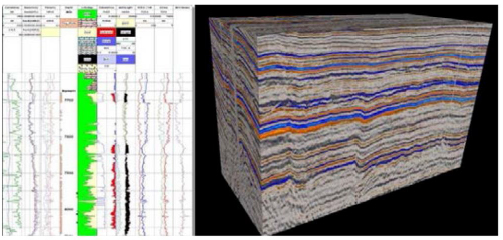 |
Fig. (2b). Petrophysics and seismic data integration. |
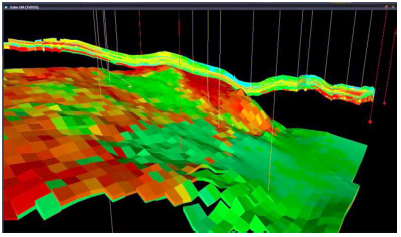 |
Fig. (2c). Subsurface earth model. |
Additionally, with this workflow, as additional well drilling, logging, completion, and production information become available; the subsurface earth model is updated on a regular basis, creating generation n+1 of the earth model. This helps provide the most current information available, which the asset team can use to collaborate using engineering tools to perform forward looking predictive modeling and uncertainty analysis. This is a key difference between conventional field data and production analytics, which first makes many major simplifying assumptions as to formation homogeneity and then looks backward to create trends and relationships, and then uses these trends to dictate future decisions.
This earth model type of sensitivity modeling creates a much better opportunity for identification of new and often unexpected relationships that can lead to significant improvements for drilling and completion opportunities. Following are some examples of how collaboration over this common subsurface earth model can be used to improve well and completion designs to improve production and economic success.
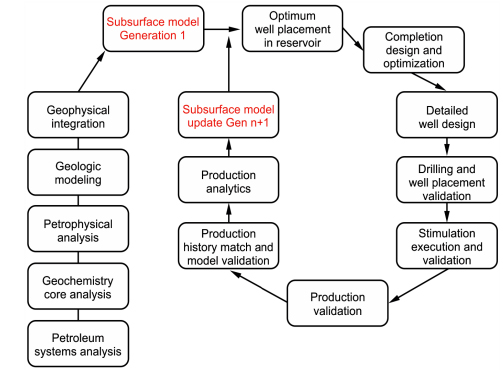 |
Fig. (3). Field development process and workflows developed over a common subsurface earth model. |
Reservoir Simulation and Uncertainty Analysis for Completion Optimization
Extracting a volume of the reservoir from the subsurface earth model and placing this information into a detailed reservoir simulator can enable several completion concepts and ideas to be tested and evaluated against different reservoir properties. This type of analysis makes it possible to determine which reservoir and completion attributes have the greatest impact on well performance and allows engineers to use this information for improved completion design. One such study has been described by Kumar et al. [12] examining sensitivity of reservoir properties, reservoir fluid properties, and completion characteristics for a region in the Eagle Ford formation in southwest Texas. In this case, 572 simulations were performed to fully evaluate effective ranges of specific parameters to determine impact and sensitivity on well performance. While this seems like a lot of cases, automation of this process enables this work to be performed relatively fast, so results can be observed in one or two days.
Fig. (4) is a tornado chart showing the sensitivity for both oil and gas cases. Here, it is interesting to note that, for a liquids rich reservoir that is more oil prone, pressure/volume/temperature (PVT) properties of the reservoir fluid have the highest impact on well performance. Of course, this is a parameter that is not controlled. However, it suggests that, in liquids rich shale reservoirs, it is critically important to understand the PVT properties of the reservoir and incorporate this information into the completion design to achieve the best results. It is also interesting to note that matrix permeability is the third most important parameter after fracture length. Unfortunately, the matrix permeability is rarely known for a given reservoir, particularly in these ultralow permeability reservoirs. This also demonstrates the importance of tuning the earth model to help ensure the best possible information is captured for the permeability for specific areas across an entire asset, opposed to a simple average permeability being assigned independent of individual well location. Fracture length, fracture spacing (number of fractures), and fracture conductivity also have significantly positive impact on well performance and must be optimized in the completion design to achieve the best well performance.
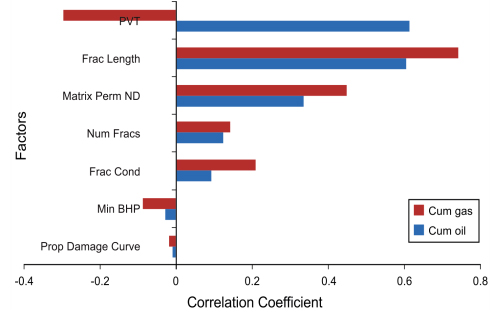 |
Fig. (4). Sensitivity results using 572 reservoir simulations for an Eagle Ford well. |
Also, some of the geological variables such as mineralogy, TOC distribution, and maturity play an important role in the actual placement of the lateral wellbore within the shale play. Mechanical properties such as Young’s modulus, Poisson’s ratio, brittleness and Brinell hardness are used by the hydraulic fracture design and evaluation software mainly during both the pre- and post-fracture evaluation processes which allows one to enter calibrated fracture models in the numerical simulation model. Fluid volume, proppant concentration and pressure data during the hydraulic fracturing job are important inputs for the calibrated hydraulic fracture models. Secondary fracture information can be inferred by interpreting microseismic, tilt meter or image log data, which can also be entered in the reservoir simulation model. Properties such as initial water saturation, effective porosity and matrix permeability (lab derived or taken from earth model data) and PVT properties are entered directly into the reservoir simulation model.
Complex Fracture Simulation
One of the most transforming concepts of fracture stimulation of the Barnett shale was the high degree of fracture complexity that was occurring. Without the use of microsiesmic monitoring this complexity would likely have never been understood in even simplistic forms. Essentially all the later source shale plays have also experienced complex fracturing, although generally to some lesser degree than that of the Barnett shale. Initially, our industry had no fracture stimulation or production simulation models that could in any way give us meaningful modeling of such complexity within our hydraulic fracturing applications. Only in recent years has the industry made meaningful headway with this problem. Modeling of complex fracture systems and the interaction of hydraulically induced and existing natural fractures within a reservoir is a very complex science, typically with very limited information available to populate engineering tools to simulate some of these complex behaviors. While there is still a tremendous amount of work on-going to try and understand the physics of this problem better, the industry is quickly coming to a stage where the new tools becoming available are capable of providing some key insight into complex fracture growth in horizontal shale completions. While none of these models is explicitly correct, the ability to create multiple realizations and changing key parameters makes it possible to begin to identify cause and effect behaviors and make better engineering decisions. Mayerhofer et al. [13] and Mirzai and Cipolla [14] discuss some of the early efforts in modeling complex fractures.
A recent study documented by Holderby et al. [15] looks at complex fracture growth behavior and incorporates information from open hole image log analysis and offset microseismic analysis along with the observed net treating pressure seen on each stage and the actual treatment volumes pumped per stage to generate representative realizations of the created fracture system on a stage by stage basis in three horizontal completions located in a liquids rich region of the Barnett shale. This study really highlights the use of multiple data sources to create realistic representations of the pre-existing natural fracture patterns showing significant variation along the horizontal wellbore. This information was then utilized in a complex fracture simulator to help understand fracture growth in this complex environment. This model is calibrated utilizing observed net fracturing pressure and the actual fluid volume injected during the treatment. This helps to constrain the model closer to reality and provides realistic approximations of the created fracture area and the total volume of the reservoir effectively stimulated around the wellbore. Fig. (5) shows the natural fracture patterns created utilizing information from open hole image logs obtained using LWD imaging technology along with offset well microseismic data. Fig. (6) shows the results when these fracture networks are placed in a complex hydraulic fracture simulator. Based upon this work there are several observations that could be made that have been summarized below:
- In regions where lower fracture complexity is anticipated, there is less stress competition between competing fractures and the amount of stress increase and net fracturing pressure increase tends to be lower. As a result, the width of the primary fractures tends to be slightly higher.
- In regions where higher fracture complexity is anticipated, there is increased stress competition between competing fractures resulting in greater stress increases and higher net fracturing pressures. As a result of this the fracture widths generated tend to be significantly smaller than in the low fracture density case.
- There is a significant difference in created fracture width between fractures in the primary fracture family direction and the secondary fracture family direction. Achieving effective proppant placement within the complex fracture system will require proppant to travel a tortuous path through narrow secondary fractures.
 |
Fig. (5). (a) Moderate complexity interval calibrated fractured network area from complex fracture model; (b) High complexity interval calibrated fractured network area from complex fracture model. |
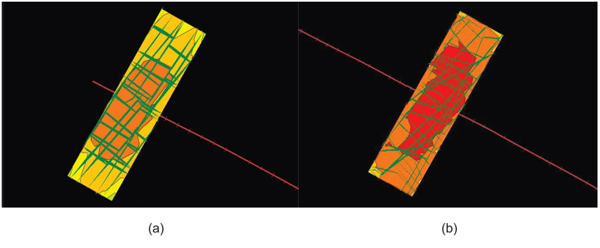 |
Fig. (6). (a) Moderate complexity interval calibrated fractured network area from complex fracture model; (b) High complexity interval calibrated fractured network area from complex fracture model. |
Coupling of Fracture and Reservoir Simulation for Fracture Design Optimization
Fracture treatment design optimization becomes a very complex process that really needs to bring together both hydraulic fracture simulation and reservoir production simulation to achieve an optimized design. The engineering workflows used to couple these models become the tool that will determine what can be done to maximize well productivity and achieve the best economic performance.
As stated above, there are several observations that can be made through analysis and interpretation of the results obtained from the complex fracture simulator. The problem here is that the way these different results relate to well productivity is not clearly understood. With extremely complex reservoir conditions in liquids rich shale, it is necessary to perform relatively robust reservoir simulations of multiple cases to understand how production can be impacted as a function of the hydraulic fracture properties in the reservoir. When we are talking about Complex Fracture Networks (CFN) within the reservoir, then advanced reservoir gridding tools are required to realistically simulate well productivity. For the most simple case, orthogonal fracture systems can be modeled using highly refined orthogonal grid systems, but when real data from image logs and microseismic come into play and the created fractures are not orthogonal, then highly refined unstructured gridding [16] is required to realistically simulate production in this environment. An example of such a reservoir model is shown in Fig. (7) which includes attributes from an earth model, alignment with primary and secondary fracture directions, separation of fracture properties from matrix properties (such as conductivities, compressibility etc.).
Fig. (7) shows a reservoir model created using unstructured gridding that incorporates attributes from an earth model and primary and secondary fracture properties obtained from CFN analysis using microseismic responses. Models such as this have a greater chance of representing the flow of hydrocarbons in complex networks.
A study was performed by Dahl et al. [11] to help understand how to maximize liquids production from a retrograde condensate region of the Barnett Shale in Wise County, Texas. This is an area where interaction of the hydraulic fracture and natural fractures often results in significantly complex fracture networks. An Engineered analysis was used in this project to determine the significance of more effectively stimulating and propping secondary natural fractures activated during the hydraulic fracturing treatment effectively creating a CFN. While the CFN was observed to have only a modest impact on gas productivity, it was a completely different outcome for liquid hydrocarbon production. Fig. (8) shows the production sensitivity to CFN simulation for gas production, while Fig. (9) shows the sensitivity to the same CFN for liquids or oil production. Here, it can be seen that more effective stimulation of CFN in a retrograde condensate can lead to significant increases in connected fracture area, which was predicted to significantly increase oil production. A strong understanding of the PVT properties of the reservoir fluids is essential; however, capturing samples of fluid representative of downhole conditions from these reservoirs can be very difficult and, in some cases, nearly impossible. For this reason, compositional modeling to create an equation of state using produced hydrocarbon composition was used throughout this study. The results of compositional modeling has proven to be far more reliable than the use of black oil or modified black oil solutions in many of these very complex fluid environments.
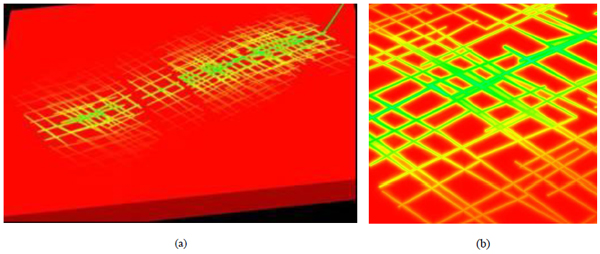 |
Fig. (7). (a) Pressure distribution after 218 days of production in a reservoir simulation model containing non-orthogonal fractures calculated by the complex fracture modeling tool based on microseismic responses; (b) Details of the pressure distribution in the complex fracture network shown in Fig. (7a). |
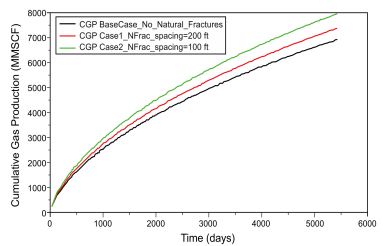 |
Fig. (8). Gas sensitivity modeling. |
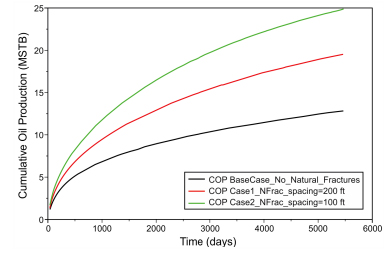 |
Fig. (9). Oil sensitivity modeling. |
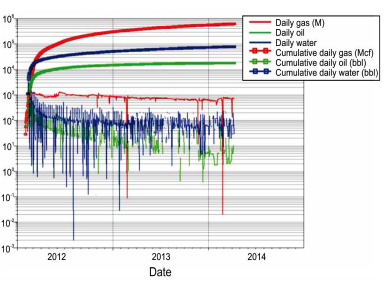 |
Fig. (10). Barnett production performance of best well before completion design changes. (>2 years of production). |
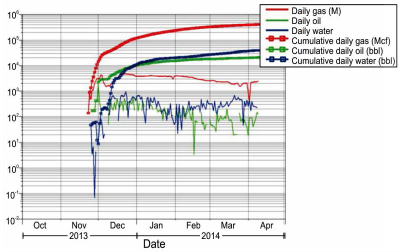 |
Fig. (11). Barnett production performance of latest well using new completion designs to stimulate natural fractures. (~4 months of production). |
This study led to several significant completion design changes. The use of a new complex fracture simulator helped the operator to understand ways to more effectively stimulate the CFN and to fully connect the created CFN to the wellbore. Reservoir simulation was used to understand the significance that these design changes would have on the expected well productivity. (Figs. 10 and 11) show the results of the best pre-study well in the region compared to the latest well drilled and completed (at the time of Dahl et al. [11] paper publication) using this new completion solution. In this case, the new technique supported the fracture and reservoir simulation work illustrated here, achieving the same cumulative oil in four months that had taken two years to achieve in the best well previous to this work.
In this Barnett case, it is important to note that the completion design changes implemented to more effectively stimulate the CFN were not intuitive and were not apparent based upon the earlier well performance in the area. In this case, the use of earth modeling, complex fracture simulation, and reservoir sensitivity analyses provided unique insight into a very complex problem and enabled the engineers to create a step change improvement in well performance in a very short period of time.
It is also important to note that during the early stages of production from a field, very little is known about the field. As the production data begin to emerge on single wells, history matching provides a means to understand the nature of the reservoir around the producing well. In general, in unconventional reservoirs, communication between adjacent wells, unless they are spaced very closely, is quite rare so the production performance represents the actual behavior of unconventional wells without the influence of other wells. The evaluation process is iterative in nature, as shown in Fig. (3), and the models get better as more and more data become available. In their discussion on unconventional gas simulation strategy and workflow, Adil et al. [17] stated that any attempt to carry out sector or full field models during early life consumes significant time and energy of the simulation experts and it may not deliver any significant value. An early focus on single well modeling is meant to direct the reservoir modeling teams to focus on the right task.
Additionally, any increase is knowledge of the reservoir properties that describe reservoir fluids, reservoir quality, or rock mechanical properties adds to the value of this analysis. In comparison to the previously mentioned trial and error methodology, this focus on understanding of the reservoir and using that knowledge to forward model anticipated results and also post-treatment match models to actual data is a huge step change in the methodology utilized in these shale reservoirs. Obviously working in an environment that is more data rich can be “easier” but time should still be spent validating and calibrating any data that is obtained about that reservoir, as the methods to obtain this data can still produce inaccuracies and statistical variation in the data. A process that focuses on the collection of data, whether great or little in amount, and utilizes that information in a modeling process to develop understanding to make better decisions is a move in the right direction in these reservoirs that have great reservoir variability.
Well Placement and Completion Design Considerations for Hydraulic Fracture Design
Another application that is significantly enhanced through the use of a collaborative subsurface earth model is the use of horizontal well correlation to identify optimum well locations within the reservoir; then, based upon well lateral location, local stress conditions and local reservoir characteristics create an optimum plan for perforating and fracture stage breakdown [18].
While well log interpretation for horizontal wells can be very difficult, creating an environment where the stratigraphic placement of the lateral section can be observed with the log curves creates an environment that is much easier for interpretation for completion and stimulation purposes. This makes it possible to determine when the wellbore is in a good reservoir location for stimulation and also when the wellbore, or maybe one or more sections of the lateral, is located in a poor reservoir location. This tool makes it possible to identify and map geohazards relative to the wellbore and provide insight to the completions engineer from a fracture treatment design perspective. This can save the cost of trying to stimulate a poor section and overall improve placement of fractures in zones that are stimulated.
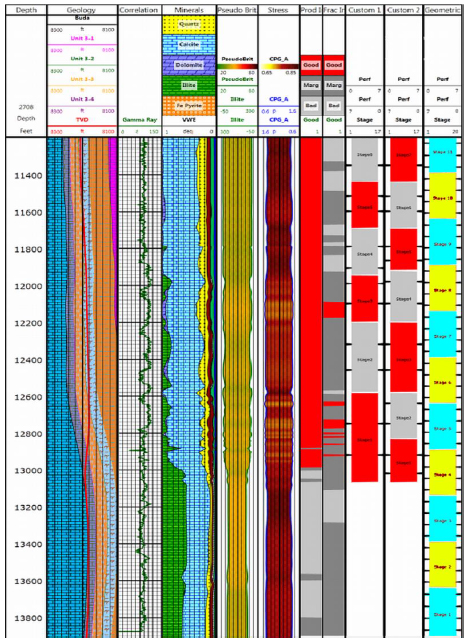 |
Fig. (12). Horizontal Eagle Ford well correlation displayed to enable better well planning and easier interpretation for completion optimization. |
This environment creates a powerful tool for planning well locations and subsequent design of the wellbore to get the lateral located in the correct place, create a geosteering plan to help ensure the lateral is placed as designed, as well as the capability to establish where to perforate and how to stimulate the well based upon both local and far field stress and localized reservoir quality. One such case is shown in Fig. (12) for an Eagle Ford well where the wellbore cuts across several stratigraphic layers with different stress and reservoir characteristics. In this case, different completion scenarios can be assessed with the potential of significantly reducing the total well cost by the elimination of fracture stages in low quality reservoir sections along the wellbore.
SUMMARY
In unconventional assets, completion design and hydraulic fracturing have become more of a statistical process; additionally, incremental improvement and innovation are used to create a treatment schedule often replicated across an entire field without consideration of the stratigraphic well location or the reservoir heterogeneity encountered along the lateral section. Based upon vertical well experience, the fracture initiation points can be carefully selected by identifying the locations within the well that are best to perforate. In a horizontal well, however, the location of the lateral defines the fracture initiation points anywhere along the well, so the stratigraphic location of the well lateral becomes critical in non-homogeneous shale plays.
In shale reservoirs, it is also highly desirable to take advantage of natural fractures whenever possible to maximize the production potential. To accomplish this, a much more detailed understanding of the subsurface is required, including natural fracture joint behavior and local stresses in the reservoir and around the wellbore.
Working together, engineers and geoscientists can identify important parameters necessary for optimum completion design, the earth model can then be used as a tool to capture and model these properties across the asset making critical information available as needed for drilling, completion, and production operations. Interestingly, if an accurate earth model can be developed this creates a powerful collaboration site where it is easier to achieve effective and productive communication across multiple disciplines within the asset team.
For areas where complex fracture growth is expected, Dahl et al. [11] provides a fracture design workflow that incorporates the use of the earth model, statistical tools to create a representative fracture fabric for the reservoir, and a complex fracture simulator coupled with reservoir simulation to create an optimized fracture treatment based on production potential.
Fig. (13) provides a visualization of this completion design and optimization workflow. It is very important to observe the feedback loops in this workflow where there is essentially a tight and fast design feedback loop between the complex fracture simulator and the reservoir simulator followed by a slower feedback loop between the reservoir simulator and the earth model.
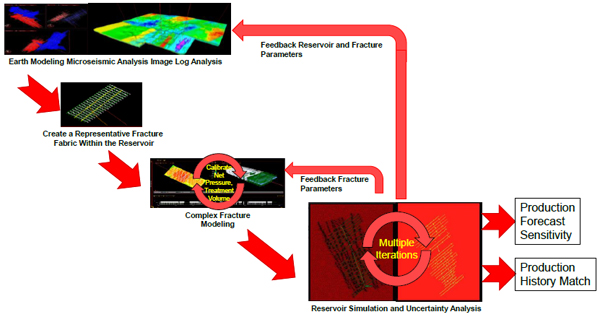 |
Fig. (13). Hydraulic fracture design workflow for modeling and optimizing complex hydraulic fracture systems. |
The fast feedback loop is used to run many cases to enable the engineers to find critical relationships between completion design and well productivity and enable the engineers to make more informed decisions on fracture design and optimization. This may include designs to consider increased fracture complexity, longer effective fracture half lengths, more fracture conductivity, etc.
The slow loop enables tools like production history matching to be incorporated that can narrow down the range of uncertainty around some reservoir parameters such as effective permeability or reservoir fluid properties. By using this approach to update and calibrate the earth model, all members of the asset team can be working with the most current and best possible information for ongoing field development activities.
The engineering tools used to complete this workflow are very new, incorporating advanced statistical microseismic analysis, stochastic natural fracture modeling, induced hydraulic fracture modeling, and very advanced and highly refined unstructured gridding within a compositional reservoir simulator. These tools combined create a very powerful engineering design tool that requires collaboration and cooperation between engineers and geoscientists to execute.
CONCLUSION
For unconventional shale assets, subsurface earth modeling creates a point where geoscientists and engineers can collaborate and enable more advanced engineering applications.
Engineering tools populated using an earth model can be used to create many representative realizations to identify opportunities for improved well performance through both well placement and completion design.
Displaying information from the earth model combined with logging while drilling (LWD) and geosteering information creates a very powerful environment for lateral placement and completion optimization.
New tools for fracture modeling allow for optimization within the completions design workflow for unconventionals where more complex geomechanics is known to affect the results of hydraulic fracturing operations.
Investigation into natural fracture density and type facilitates better descriptions of induced fracture interactions with the preexisting natural fracture network common to many unconventionals.
New unstructured grid based reservoir modeling and simulation tools that can accept complex fracture networks calculated from microseismic and/or image log responses show potential to better represent the flow of hydrocarbons in hydraulically fractured shale reservoirs.
It is often necessary to enhance the original 3D surface seismic understandings with data such as geomechanical descriptions and fracture development behavior from core, logging, microseismic monitoring, and reservoir descriptions. These can help the asset team better understand the impact of this fracture system on production play an integral part in the development considerations for unconventional plays, despite historical industry standards of less focus on these areas for these types of assets.
CONFLICT OF INTEREST
The authors confirm that this article content has no conflict of interest.
ACKNOWLEDGEMENTS
The authors thank Devon Energy and Halliburton for the permission to publish this material.


