
LETTER
RDR Application: An Accurate HTHP Rheological Modeling for The Sulphonated Water-Based Drilling Fluid
Lin Xu1, 3, *, Han Gao2, Ming-biao Xu3, Fu-chang You4, Xiao-liang Wang4
Article Information

Identifiers and Pagination:
Year: 2017Volume: 10
First Page: 251
Last Page: 262
Publisher Id: TOPEJ-10-251
DOI: 10.2174/1874834101710010251
Article History:
Received Date: 24/03/2017Revision Received Date: 28/06/2017
Acceptance Date: 03/10/2017
Electronic publication date: 30/11/2017
Collection year: 2017
open-access license: This is an open access article distributed under the terms of the Creative Commons Attribution 4.0 International Public License (CC-BY 4.0), a copy of which is available at: https://creativecommons.org/licenses/by/4.0/legalcode. This license permits unrestricted use, distribution, and reproduction in any medium, provided the original author and source are credited.
Abstract
Introduction:
An accurate HTHP rheological model of drilling fluids is critical for the safe and economic drilling operation. However, general HTHP rheological modeling methods appear to be very limited in the predictive accuracy.
Materials and Method:
In this work, a particular relative dial readings(RDR) modeling experiment was conducted on a weighted sulphonated water-based drilling fluid within a certain temperature and pressure range(30-150°C, 0.1-100MPa), in combination to dial reading data of six specific shear rates 3, 6, 100, 200, 300, and 600rpm, to develop a highly accurate HTHP rheological model. The RDR modeling procedure was investigated in details, including relative dial reading, Arrhenius relation, polynomial of pressure coefficients, and polynomial of shear rate coefficients. An equation relating RDR to temperature, pressure, and shear rate was determined.
Results:
The predictive deviation was calculated to be lower than 11.7%, and large errors occurred under the conditions of high pressure and low shear rates; all of which meet the requirement of in-field predictive accuracy. These results not only provide an accurate HTHP rheological equation for the weighted sulphonated water-based drilling fluid, but also propose an effective HTHP rheological modeling strategy for drilling fluids.
1. INTRODUCTION
The rheological properties of drilling fluids are always critical upon drilling. Reasonable control of rheology can direct some key operation designs such as hydraulic calculation, pressure loss calculation, hole cleaning efficiency, and equivalent circulating density(ECD) determination, which enable high rate of penetration(ROP) and low drilling cost. The determination of rheological data relies, to a large extent, on a rheological mathematic representation, which allows an accurate theoretical prediction. Therefore, the rheological modeling of drilling fluids usually behaves as the first step especially in the high temperature high pressure(HTHP) drilling operation.
However, it is well-known that in deep drilling operations, rheology of drilling fluid is relatively complicated and often influenced by temperature, pressure, shear history, and composition of the drilling fluids [1-5]. Otherwise, effects of temperature and pressure on rheology of drilling fluids appear to be reverse in the down-hole conditions. Not surprisingly, developing a correlation that will relate shear stress to temperature, pressure, and shear rate should be difficult for drilling fluids. In the last 20-30 years, two important HTHP rheological modeling strategies, i.e., multiplicative factor(MF) and relative dial reading(RDR) approach, have been developed. But only limited studies on these two modeling application have been referred. As for the MF modeling approach, it is necessary to firstly fit the actual dial reading data to a general rheological model; while for the RDR approach, the relation that relates dial reading(shear stress) of a particular fluid at different temperature, pressure, and shear rate conditions can be directly determined. Undoubtedly, the latter approach should be more accurate because of avoidance of general model assumption, when compared to the former one.
In this work, the weighted sulphonated water-based fluid was used to explore applicability of the RDR modeling approach in combination to operation environments in Southwest China Gas Fields. To shed more light on HTHP rheological modeling, development of HTHP rheological model of drilling fluids will be further illustrated below.
1.1. General HTHP Rheological Modeling Process
The general rheological modeling process involves two steps: one is to fit dial reading(or shear stress) and shear rate values to specific rheological equations(e.g., Yield Power Law and Bingham Plastic models); the other is to determine the effect of temperature and pressure on dial readings and define correction factors to correlate rheological parameters in down-hole conditions. The commonly reported correction factor is shown as follows:
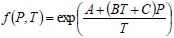 |
(1) |
where A, B, and C are characteristic constants. Following Eq.(1), McMordie et al. [6] modified the power-law model as,
 |
(2) |
where K’ and n correspond to the consistency index and behavior index, respectively. This HTHP rheological model has been successfully used in the oil-based drilling fluid. Similarly, Houwen [7], Hiller [8], and Alderman [9] have applied the MF method to the two-parameter Casson and Bingham plastic models, as well as three-parameter Hurschel-Bulkley and Robertson-Stiff models. On the basis of modeling procedure and results, they concluded that the correlation of parameters in base equations can disturb the final predictive accuracy.
To diminish the correlation of parameters, Rommetveit et al. [10] proposed another way to construct base equation, which is written as,
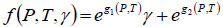 |
(3) |
where f(P, T, γ) is a factor that multiplies shear stress obtained at considered conditions. The constant functions g1(P, T) and g2(P, T) are determined by an optimistic fit to measured data. In this case, the intrinsic defects of the selected base models can be avoided, which makes prediction more accurate.
American Petroleum Institute(API) recommends the HTHP rheological model:
 |
(4) |
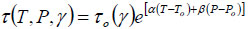
where τo denotes the shear stress at a given rotational speed. This model is extended to viscosity expressions [11, 12].
It should be noted that upon modeling, general HTHP rheological models depend on the initial base equation and Arrhenius empirical relations, which can cause a large predictive deviation.
1.2. Specific HTHP Rheological Modeling Process
To avoid designation of initial rheological model, a specific HTHP rheological modeling process based on the RDR approach was developed by Hemphill [13]. Rather than using a designated rheological model, it directly correlated the changes in dial readings with temperature, pressure, and shear rate by the non-linear regression method. All the results were related to a relative parameter measured at To and Po. The RDR are defined as:
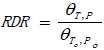 |
(5) |
where θ is the dial reading and To and Po are the relative temperature and pressure, respectively. Combining with Arrhenius Relation, the RDR model is rewritten as:
 |
(6) |
where C1 and C2 are model coefficients that are dependent on the pressure and shear rate.
Using the RDR approach, an accurate HTHP rheological model was developed at eight specific shear rates under HTHP conditions(50-240oF, 0-8000psig) for an ester-based drilling fluid. Similarly, Demirdal [14] applied the RDR approach to establish an accurate HTHP rheological model for ester-based mud under HTHP conditions(40-280oF, 500-12000psig). As for the RDR modeling strategy, it is not necessary to use a rheological model as the base equation and, thus, the assumption of base rheological model can be avoided.
Previous RDR modeling studies focused mainly on ester- and synthetic-based drilling fluids and, consequently, the implication of RDR approach on the model applicability and the predictive accuracy in non-aqueous drilling fluids, is increasingly coming to light. In contrast, the RDR approach involved in HTHP rheological modeling for water-based drilling fluid has not been reported so far. Herein, the RDR approach was utilized to reveal its applicability of developing a highly accurate HTHP rheological equation in a weighted sulphonated water-based drilling fluid. This work on the RDR application in the water-based drilling fluid is complementary with respect to non-aqueous drilling fluids, which can not only determine a relation that relates RDRs with temperature, pressure, and shear rate, but also verify the validity of RDR approach as a novel HTHP rheological modeling tool for particular drilling fluids.
2. METHODOLOGY
2.1. Experimental Materials
The sulphonated water-based drilling fluid, as a common kind of HTHP drilling fluid, was typically employed in the oil and gas industry. Such fluid has a high density of 1.5g/ml, and consists of at least 7 functional additives such as hydrophilic solid phase, pH control agent, loss control agent, viscosifier, inhibitor, antioxidant, and weighting material was employed here, as shown in Table 1. The drilling fluid was heat-aged at 180°C for 16 hours before testing.
| Additives | Components | Content (wt.%) |
|---|---|---|
| -- | Water | -- |
| -- | Clay | 4~5 |
| pH-adjusting agent | Sodium hydroxide | 0.5 |
| viscosifier | PAMS copolymer | 1.0 |
| viscosifier | Amphoteric sulfonated polymer | 0.5 |
| Filtrate loss reducer | Sulfonated phenolic resin | 4 |
| Filtrate loss reducer | Lignosulfonate | 4 |
| Weighting material | Barite | -- |
2.2. Examination on Rheological Data
Pressures applied in the tests were 0.1, 15, 25, 55, 85, and 100MPa. Temperatures used during the tests were 30, 60, 90, 120, and 150°C. At each combination of pressure and temperature, the rheological data(dial readings) of the weighted sulphonated drilling fluid were measured at six specific shear rates 600, 300, 200, 100, 6, and 3rpm, using a Fann IX77 HTHP Rheometer.
To establish an accurate equation, both statistics and detailed sample selection are essential. In principle, the more the testing data, the more accurate the final formula. Although the statistic data seem to be not enough, the RDR approach was previously demonstrated to be accurate in defining a HTHP rheological model even with limited parameters [13, 14].
2.3. Modeling Procedure
The RDR approach was employed to determine a single relation that relates dial readings with shear rate, temperature, and pressure. The standard procedure of RDR modeling contains relative dial reading, Arrhenius relation, polynomial of pressure coefficients, and polynomial of shear rate coefficients, as shown in Fig. (1). To determine such an equation, non-linear and linear regression analysis has been used by a commercial software STATISTIC. Note that, on account of the requirements of accuracy, different expressions like logarithmic, exponential, and polynomial model can be obtained upon fitting.
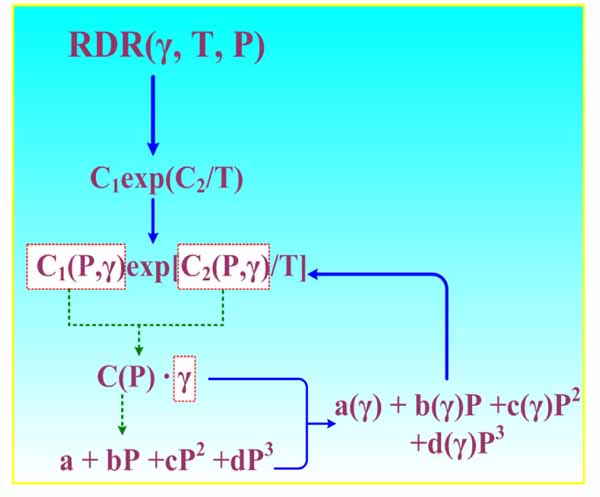 |
Fig. (1). HTHP rheological Modeling procedure of the RDR approach. |
3. RESULTS AND DISCUSSION
3.1. Relative Procedure of Dial Readings
To reduce the effect of T and P, a relative treatment was performed on dial reading data. Herein, RDR is defined as the ratio of the dial reading determined at any temperature and pressure to the dial reading determined at 0.1MPa and 30°C, shown as follows:
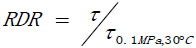 |
(7) |
Table 2 collects the dial readings and RDRs under the considered conditions. As might be anticipated, the water-based fluid is rarely pressure-dependent and highly temperature-dependent. Meanwhile, pressure effects on rheology can slightly rise at high temperature and low shear rates.
| P (MPa) |
T (°C) |
Shear Rates (rpm) | |||||
|---|---|---|---|---|---|---|---|
| 600 | 300 | 200 | 100 | 6 | 3 | ||
| 100 | 60 | 116(0.5577) | 87(0.5241) | 77(0.5238) | 66(0.5410) | 53(0.5761) | 53(0.6023) |
| 100 | 90 | 68(0.3269) | 47(0.2831) | 39(0.2653) | 32(0.2623) | 25(0.2717) | 24(0.2727) |
| 100 | 120 | 49(0.2356) | 31(0.1867) | 25(0.1701) | 18(0.1475) | 13(0.1413) | 13(0.1477) |
| 100 | 150 | 38(0.1827) | 21(0.1265) | 16(0.1088) | 11(0.0902) | 7(0.0761) | 7(0.0795) |
| 85 | 60 | 117(0.5625) | 88(0.5301) | 78(0.5306) | 67(0.5492) | 54(0.5870) | 53(0.6023) |
| 85 | 90 | 68(0.3269) | 47(0.2831) | 39(0.2653) | 32(0.2623) | 25(0.2717) | 24(0.2727) |
| 85 | 120 | 49(0.2356) | 31(0.1867) | 25(0.1701) | 18(0.1475) | 13(0.1413) | 13(0.1477) |
| 85 | 150 | 38(0.1827) | 21(0.1265) | 16(0.1088) | 11(0.0902) | 8(0.0870) | 7(0.0795) |
| 55 | 60 | 117(0.5625) | 87(0.5241) | 77(0.5238) | 66(0.5410) | 53(0.5761) | 52(0.5909) |
| 55 | 90 | 68(0.3269) | 47(0.2831) | 40(0.2721) | 33(0.2705) | 25(0.2717) | 24(0.2727) |
| 55 | 120 | 49(0.2356) | 31(0.1867) | 26(0.1769) | 19(0.1557) | 14(0.1522) | 13(0.1477) |
| 55 | 150 | 38(0.1827) | 22(0.1325) | 17(0.1156) | 12(0.0984) | 8(0.0870) | 7(0.0795) |
| 25 | 60 | 117(0.5625) | 87(0.5241) | 77(0.5238) | 66(0.5410) | 53(0.5761) | 52(0.5909) |
| 25 | 90 | 68(0.3269) | 47(0.2831) | 40(0.2721) | 33(0.2705) | 25(0.2717) | 24(0.2727) |
| 25 | 120 | 49(0.2356) | 31(0.1867) | 26(0.1769) | 19(0.1557) | 14(0.1522) | 13(0.1477) |
| 25 | 150 | 38(0.1827) | 22(0.1325) | 17(0.1156) | 12(0.0984) | 7(0.0761) | 7(0.0795) |
| 15 | 60 | 115(0.5529) | 86(0.5181) | 76(0.5170) | 65(0.5328) | 53(0.5761) | 52(0.5909) |
| 15 | 90 | 68(0.3269) | 47(0.2831) | 40(0.2721) | 33(0.2705) | 25(0.2717) | 24(0.2727) |
| 15 | 120 | 49(0.2356) | 31(0.1867) | 25(0.1701) | 18(0.1475) | 14(0.1522) | 13(0.1477) |
| 15 | 150 | 38(0.1827) | 22(0.1325) | 17(0.1156) | 12(0.0984) | 8(0.0870) | 8(0.0909) |
| 0.1 | 30 | 208(1) | 166(1) | 147(1) | 122(1) | 92(1) | 88(1) |
b Data in parenthesis correspond to RDRs.
3.2. Arrhenius Relation Between RDRs and Temperature
Arrhenius relation is considered to be appropriate to relate RDR to temperature. RDR(T) in terms of the investigated parameters can be shown as follows:
 |
(8) |
wherein C1 and C2 are coefficients of Arrhenius relation.
Table 3 presents the coefficient analysis of RDR vs. T for Arrhenius relation. It is clear that all of the correlations(R2) are larger than 0.98, and the average value is 0.9886±0.0035, suggesting a high predictive accuracy for Arrhenius relation.
| P(MPa) | γ(rpm) | C1 | C2 | R2 |
|---|---|---|---|---|
| 100 | 3 | 0.0375 | 167.2237 | 0.9857 |
| 6 | 0.0376 | 164.3890 | 0.9807 | |
| 100 | 0.0423 | 153.5008 | 0.9861 | |
| 200 | 0.0528 | 138.1225 | 0.9900 | |
| 300 | 0.0643 | 126.4127 | 0.9892 | |
| 600 | 0.0976 | 104.9750 | 0.9953 | |
| 85 | 3 | 0.0375 | 167.2237 | 0.9857 |
| 6 | 0.0385 | 164.0179 | 0.9865 | |
| 100 | 0.0416 | 155.4050 | 0.9873 | |
| 200 | 0.0521 | 139.7473 | 0.9909 | |
| 300 | 0.0635 | 127.8266 | 0.9901 | |
| 600 | 0.0967 | 106.0262 | 0.9958 | |
| 55 | 3 | 0.0383 | 164.7892 | 0.9842 |
| 6 | 0.0413 | 158.7604 | 0.9857 | |
| 100 | 0.0469 | 147.3398 | 0.9859 | |
| 200 | 0.0572 | 133.3671 | 0.9897 | |
| 300 | 0.0658 | 124.9897 | 0.9917 | |
| 600 | 0.0967 | 106.0262 | 0.9958 | |
| 25 | 3 | 0.0383 | 164.7892 | 0.9842 |
| 6 | 0.0395 | 161.4868 | 0.9808 | |
| 100 | 0.0469 | 147.3398 | 0.9859 | |
| 200 | 0.0572 | 133.3671 | 0.9897 | |
| 300 | 0.0658 | 124.9897 | 0.9917 | |
| 600 | 0.0967 | 106.0262 | 0.9958 | |
| 15 | 3 | 0.0401 | 161.9553 | 0.9885 |
| 6 | 0.0413 | 158.7615 | 0.9857 | |
| 100 | 0.0461 | 147.5490 | 0.9837 | |
| 200 | 0.0565 | 133.3969 | 0.9889 | |
| 300 | 0.0667 | 123.5629 | 0.9908 | |
| 600 | 0.985 | 103.9176 | 0.9947 |
3.3. Modeling of Coefficient C1 and C2vs. P
Once the relation between RDR and T was determined, the next step was to determine whether coefficients of the model(C1 and C2) are dependent on P and γ. Table 4 shows that both C1 and C2 are functions of P and γ. If these coefficients are defined as the functions of P and γ, RDR(T, P, γ) can be written as (5).
In order to get a general expression, the regression analysis was carried out to determine the effect of P and γ on these constants(C1 and C2). Herein, the effect of P on C1 and C2 under constant γ was analysed . Third degree polynomial defines the relation of C1 and C2 vs. P as:
 |
(9) |
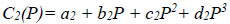 |
(10) |
wherein a, b, c, and d are the model coefficients.
| Coefficients | C1(P) | ||||||||
|---|---|---|---|---|---|---|---|---|---|
| 3 | 6 | 100 | 200 | 300 | 600 | ||||
| a1 | 0.73 | 0.72 | 0.31 | 0.20 | 0.13 | 0.18 | |||
| b1 | -4.0×10⁻⁴ | -4.0×10⁻⁴ | -5.0×10⁻⁵ | -8.6E-6 | 4.0×10⁻⁵ | 2.0×10⁻⁵ | |||
| c1 | -6.5×10⁻⁸ | -6.4×10⁻⁸ | -1.2×10⁻⁸ | -2.9×10⁻⁹ | 6.0×10⁻⁹ | 3.9×10⁻¹⁰ | |||
| d1 | -3.2×10⁻¹² | -3.2×10⁻¹² | -7.8×10⁻¹³ | -1.5×10⁻¹³ | 2.8×10⁻¹³ | -1.5×10⁻¹⁴ | |||
| R2 | 0.998 | 0.997 | 0.999 | 0.995 | 0.997 | 0.998 | |||
| C2(P) | |||||||||
| a2 | -251.34 | 41.66 | 11.75 | 50.18 | 75.78 | 74.46 | |||
| b2 | -0.17 | 0.04 | -1.5×10⁻² | -2.7×10⁻³ | 0.01 | 5.5×10⁻³ | |||
| c2 | -3.0×10⁻⁵ | 4.1×10⁻⁶ | -2.0×10⁻⁶ | -9.7×10⁻⁸ | 2.1×10⁻⁶ | 9.8×10⁻⁷ | |||
| d2 | -1.5×10⁻⁹ | 3.0×10⁻¹¹ | -9.9×10⁻¹¹ | -7.0×10⁻¹² | 9.7×10⁻¹¹ | 3.7×10⁻¹¹ | |||
| R2 | 0.996 | 0.995 | 0.995 | 0.996 | 0.994 | 0.996 | |||
It can be readily found that coefficients of multiple determination(R2) for C1(P) and C2(P) are all close to 1.0, which reveals significant correlation between the actual and predictive values. Apparently, the proposed third degree polynomial is quite suitable to fit C(P). Next, C1(P) and C2(P) were further used to establish C1(P, γ) and C2(P, γ).
3.4. Relation Betwen Coefficients of C1(P) and C2(P) and γ
In order to determine C1(P, γ) and C2(P, γ), the effect of γ on coefficients(a, b, c, and d) shown in C(P) should be determined. Non-linear regression analysis was carried out using either one-parameter or two-parameter curves. The relations between the coefficients of C1(P) and C2(P) and γ are presented in Table 5.
| C(P) | Equations of Coefficients of C(P) vs. γ | R2 |
|---|---|---|
| C1 | a = (1.32073 + 0.02104 γ)1/1.06571 | 0.998 |
| b = −0.00065 + 0.00012ln(γ + 5.37232) | 0.986 | |
| c = (−1.1431×10⁻⁷)−2.1299×10⁻⁸(γ + 6.18217) | 0.992 | |
| d = (−6.3934×10⁻¹²)−2.1299×10⁻⁸ (γ + 11.02309) | 0.996 | |
| C2 | a = 6.80525 + 7.38181 ln (γ −3) | 0.983 |
| b = 0.0133 + 0.004351 ln (γ −3) | 0.894 | |
| c = (−2.3171×10⁻⁶) + 7.6818×10⁻⁷ ln (γ − 3) | 0.942 | |
| d = (−1.5396×10⁻¹⁰) + 3.7431×10⁻¹¹ ln (γ − 3) | 0.978 |
Listed in Table 5 are the relation that well relate coefficient of C(p) to shear rate. For all relation, R2 values are almost equal to 0.9, and average value is as high as 0.971±0.027, suggesting a good relation between the predictive and actual values. Substituting relations listed in Table 5 to C1(P) and C2(P), the coefficients C can be shown as a function of P and γ as follows:
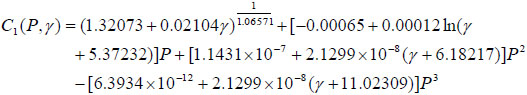 |
(11) |
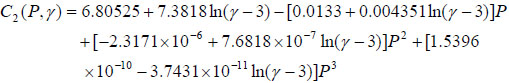 |
(12) |
These two Eq.11 and Eq.12 achieved above can be further substituted into RDR(T). As a consequence, a function relating RDR to T, P, and γ can be determined by using one equation (see Eq. 7).
3.5. Analysis on Deviation of RDR Rheolical Model
Analysis on the predictive deviation of HTHP rheological model developed here was further carried out to evaluate its applicability. Table 6 lists main results, including the tested and calculated dial readings, residual, and absolute error. The absolute error percentages vary in the range of 0~12%, and the average error percentage is calculated as 3.3397±2.2006, which reflects high predictive accuracy for the developed HTHP rheological equation within certain temperature and pressure range.
| No | Independent Variables | Dial Readings | Residual | Absolute Error (%) |
|||
|---|---|---|---|---|---|---|---|
| P(MPa) | T(oC) | γ(rpm) | Factual | Calculated | |||
| 1 | 100 | 60 | 3 | 20.6023 | 0.6037 | -1.39×10⁻³ | 0.23 |
| 2 | 100 | 60 | 6 | 0.5761 | 0.5676 | 8.50×10⁻³ | 1.48 |
| 3 | 100 | 60 | 100 | 0.5410 | 0.5279 | 1.31×10⁻² | 2.42 |
| 4 | 100 | 60 | 200 | 0.5238 | 0.5223 | 1.55×10⁻³ | 0.30 |
| 5 | 100 | 60 | 300 | 0.5241 | 0.5281 | -4.04×10⁻³ | 0.77 |
| 6 | 100 | 60 | 600 | 0.5577 | 0.5581 | -3.83×10⁻⁴ | 0.07 |
| 7 | 100 | 90 | 3 | 0.2727 | 0.2734 | -6.30×10⁻⁴ | 0.23 |
| 8 | 100 | 90 | 6 | 0.2717 | 0.2583 | 1.34×10⁻² | 4.93 |
| 9 | 100 | 90 | 100 | 0.2623 | 0.2470 | 1.53×10⁻² | 5.82 |
| 10 | 100 | 90 | 200 | 0.2653 | 0.2647 | 5.90×10⁻⁴ | 0.22 |
| 11 | 100 | 90 | 300 | 0.2831 | 0.2878 | -4.69×10⁻³ | 1.65 |
| 12 | 100 | 90 | 600 | 0.3269 | 0.3267 | 1.88×10⁻⁴ | 0.06 |
| 13 | 100 | 120 | 3 | 0.1477 | 0.1469 | 8.73×10⁻⁴ | 0.59 |
| 14 | 100 | 120 | 6 | 0.1413 | 0.1367 | 4.64×10⁻³ | 3.29 |
| 15 | 100 | 120 | 100 | 0.1475 | 0.1372 | 1.03×10⁻² | 6.98 |
| 16 | 100 | 120 | 200 | 0.1701 | 0.1613 | 8.73×10⁻³ | 5.14 |
| 17 | 100 | 120 | 300 | 0.1867 | 0.1881 | -1.39×10⁻³ | 0.75 |
| 18 | 100 | 120 | 600 | 0.2356 | 0.2336 | 1.94×10⁻³ | 0.82 |
| 19 | 100 | 150 | 3 | 0.0795 | 0.0823 | -2.74×10⁻³ | 3.44 |
| 20 | 100 | 150 | 6 | 0.0761 | 0.0729 | 3.17×10⁻³ | 4.17 |
| 21 | 100 | 150 | 100 | 0.0902 | 0.0801 | 1.01×10⁻² | 11.20 |
| 22 | 100 | 150 | 200 | 0.1088 | 0.1062 | 2.67×10⁻³ | 2.46 |
| 23 | 100 | 150 | 300 | 0.1265 | 0.1334 | -6.90×10⁻³ | 5.45 |
| 24 | 100 | 150 | 600 | 0.1827 | 0.1839 | -1.16×10⁻³ | 0.64 |
| 25 | 85 | 60 | 3 | 0.6023 | 0.6014 | 8.35×10⁻⁴ | 0.14 |
| 26 | 85 | 60 | 6 | 0.5870 | 0.5795 | 7.41×10⁻³ | 1.26 |
| 27 | 85 | 60 | 100 | 0.5492 | 0.5367 | 1.25×10⁻² | 2.27 |
| 28 | 85 | 60 | 200 | 0.5306 | 0.5264 | 4.22×10⁻³ | 0.79 |
| 29 | 85 | 60 | 300 | 0.5301 | 0.5305 | -4.15×10⁻⁴ | 0.08 |
| 30 | 85 | 60 | 600 | 0.5625 | 0.5604 | 2.07×10⁻³ | 0.37 |
| 31 | 85 | 90 | 3 | 0.2727 | 0.2733 | -5.90×10⁻⁴ | 0.22 |
| 32 | 85 | 90 | 6 | 0.2717 | 0.2650 | 6.76×10⁻³ | 2.49 |
| 33 | 85 | 90 | 100 | 0.2623 | 0.2527 | 9.57×10⁻³ | 3.65 |
| 34 | 85 | 90 | 200 | 0.2653 | 0.2661 | -7.54×10⁻⁴ | 0.28 |
| 35 | 85 | 90 | 300 | 0.2831 | 0.2875 | -4.35×10⁻³ | 1.54 |
| 36 | 85 | 90 | 600 | 0.3269 | 0.3271 | -2.25×10⁻⁴ | 0.07 |
| 37 | 85 | 120 | 3 | 0.1477 | 0.1475 | 2.69×10⁻⁴ | 0.18 |
| 38 | 85 | 120 | 6 | 0.1413 | 0.1434 | -2.06×10⁻³ | 1.46 |
| 39 | 85 | 120 | 100 | 0.1475 | 0.1416 | 5.89×10⁻³ | 3.99 |
| 40 | 85 | 120 | 200 | 0.1701 | 0.1624 | 7.71×10⁻³ | 4.53 |
| 41 | 85 | 120 | 300 | 0.1867 | 0.1879 | -1.13×10⁻³ | 0.60 |
| 42 | 85 | 120 | 600 | 0.2356 | 0.2337 | 1.84×10⁻³ | 0.78 |
| 43 | 85 | 150 | 3 | 0.0795 | 0.0831 | -3.57×10⁻³ | 4.49 |
| 44 | 85 | 150 | 6 | 0.0870 | 0.0807 | 6.25×10⁻³ | 7.18 |
| 45 | 85 | 150 | 100 | 0.0902 | 0.0838 | 6.38×10⁻³ | 7.08 |
| 46 | 85 | 150 | 200 | 0.1088 | 0.1074 | 1.44×10⁻³ | 1.32 |
| 47 | 85 | 150 | 300 | 0.1265 | 0.1337 | -7.23×10⁻³ | 5.72 |
| 48 | 85 | 150 | 600 | 0.1827 | 0.1840 | -1.30×10⁻³ | 0.71 |
| 49 | 55 | 60 | 3 | 0.5909 | 0.5924 | -1.51×10⁻³ | 0.26 |
| 50 | 55 | 60 | 6 | 0.5761 | 0.5785 | -2.41×10⁻³ | 0.42 |
| 51 | 55 | 60 | 100 | 0.5410 | 0.5409 | 4.56×10⁻⁵ | 0.01 |
| 52 | 55 | 60 | 200 | 0.5238 | 0.5252 | -1.42×10⁻³ | 0.27 |
| 53 | 55 | 60 | 300 | 0.5241 | 0.5282 | -4.13×10⁻³ | 0.79 |
| 54 | 55 | 60 | 600 | 0.5625 | 0.5647 | -2.20×10⁻³ | 0.39 |
| 55 | 55 | 90 | 3 | 0.2727 | 0.2721 | 6.68×10⁻⁴ | 0.24 |
| 56 | 55 | 90 | 6 | 0.2717 | 0.2721 | -3.40×10⁻⁴ | 0.12 |
| 57 | 55 | 90 | 100 | 0.2705 | 0.2670 | 3.48×10⁻³ | 1.29 |
| 58 | 55 | 90 | 200 | 0.2721 | 0.2706 | 1.50×10⁻³ | 0.55 |
| 59 | 55 | 90 | 300 | 0.2831 | 0.2875 | -4.41×10⁻³ | 1.56 |
| 60 | 55 | 90 | 600 | 0.3269 | 0.3274 | -4.77×10⁻⁴ | 0.15 |
| 61 | 55 | 120 | 3 | 0.1477 | 0.1470 | 6.84×10⁻⁴ | 0.46 |
| 62 | 55 | 120 | 6 | 0.1522 | 0.1499 | 2.31×10⁻³ | 1.52 |
| 63 | 55 | 120 | 100 | 0.1557 | 0.1553 | 4.66×10⁻⁴ | 0.30 |
| 64 | 55 | 120 | 200 | 0.1769 | 0.1682 | 8.65×10⁻³ | 4.89 |
| 65 | 55 | 120 | 300 | 0.1867 | 0.1897 | -2.92×10⁻³ | 1.57 |
| 66 | 55 | 120 | 600 | 0.2356 | 0.2335 | 2.12×10⁻³ | 0.90 |
| 67 | 55 | 150 | 3 | 0.0795 | 0.0821 | -2.51×10⁻³ | 3.16 |
| 68 | 55 | 150 | 6 | 0.0870 | 0.0850 | 1.92×10⁻³ | 2.21 |
| 69 | 55 | 150 | 100 | 0.0984 | 0.0948 | 3.57×10⁻³ | 3.63 |
| 70 | 55 | 150 | 200 | 0.1156 | 0.1135 | 2.16×10⁻³ | 1.86 |
| 71 | 55 | 150 | 300 | 0.1325 | 0.1368 | -4.32×10⁻³ | 3.26 |
| 72 | 55 | 150 | 600 | 0.1827 | 0.1840 | -1.28×10⁻³ | 0.70 |
| 73 | 25 | 60 | 3 | 0.5909 | 0.5886 | 2.31×10⁻³ | 0.39 |
| 74 | 25 | 60 | 6 | 0.5761 | 0.5748 | 1.31×10⁻³ | 0.23 |
| 75 | 25 | 60 | 100 | 0.5410 | 0.5371 | 3.84×10⁻³ | 0.71 |
| 76 | 25 | 60 | 200 | 0.5238 | 0.5197 | 4.14×10⁻³ | 0.79 |
| 77 | 25 | 60 | 300 | 0.5241 | 0.5221 | 1.99×10⁻³ | 0.38 |
| 78 | 25 | 60 | 600 | 0.5625 | 0.5599 | 2.64×10⁻³ | 0.47 |
| 79 | 25 | 90 | 3 | 0.2727 | 0.2719 | 8.66×10⁻⁴ | 0.32 |
| 80 | 25 | 90 | 6 | 0.2717 | 0.2736 | -1.90×10⁻³ | 0.70 |
| 81 | 25 | 90 | 100 | 0.2705 | 0.2694 | 1.06×10⁻³ | 0.39 |
| 82 | 25 | 90 | 200 | 0.2721 | 0.2706 | 1.48×10⁻³ | 0.54 |
| 83 | 25 | 90 | 300 | 0.2831 | 0.2866 | -3.43×10⁻³ | 1.21 |
| 84 | 25 | 90 | 600 | 0.3269 | 0.3270 | -3.82×10⁻⁵ | 0.01 |
| 85 | 25 | 120 | 3 | 0.1477 | 0.1479 | -1.56×10⁻⁴ | 0.11 |
| 86 | 25 | 120 | 6 | 0.1522 | 0.1511 | 1.03×10⁻³ | 0.68 |
| 87 | 25 | 120 | 100 | 0.1557 | 0.1599 | -4.12×10⁻³ | 2.65 |
| 88 | 25 | 120 | 200 | 0.1769 | 0.1698 | 7.03×10⁻³ | 3.97 |
| 89 | 25 | 120 | 300 | 0.1867 | 0.1899 | -3.11×10⁻³ | 1.66 |
| 90 | 25 | 120 | 600 | 0.2356 | 0.2337 | 1.83×10⁻³ | 0.78 |
| 91 | 25 | 150 | 3 | 0.0795 | 0.0833 | -3.71×10⁻³ | 4.66 |
| 92 | 25 | 150 | 6 | 0.0761 | 0.0850 | -8.90×10⁻³ | 11.70 |
| 93 | 25 | 150 | 100 | 0.0984 | 0.1004 | -2.01×10⁻³ | 2.04 |
| 94 | 25 | 150 | 200 | 0.1156 | 0.1157 | -2.87×10⁻⁵ | 0.02 |
| 95 | 25 | 150 | 300 | 0.1325 | 0.1372 | -4.68×10⁻³ | 3.53 |
| 96 | 25 | 150 | 600 | 0.1827 | 0.1841 | -1.45×10⁻³ | 0.79 |
| 97 | 15 | 60 | 3 | 0.5909 | 0.5908 | 8.39×10⁻⁵ | 0.01 |
| 98 | 15 | 60 | 6 | 0.5761 | 0.5793 | -3.21×10⁻³ | 0.56 |
| 99 | 15 | 60 | 100 | 0.5328 | 0.5361 | -3.35×10⁻³ | 0.63 |
| 100 | 15 | 60 | 200 | 0.5170 | 0.5185 | -1.54×10⁻³ | 0.30 |
| 101 | 15 | 60 | 300 | 0.5181 | 0.5204 | -2.32×10⁻³ | 0.45 |
| 102 | 15 | 60 | 600 | 0.5529 | 0.5545 | -1.57×10⁻³ | 0.28 |
| 103 | 15 | 90 | 3 | 0.2727 | 0.2726 | 1.51×10⁻⁴ | 0.06 |
| 104 | 15 | 90 | 6 | 0.2717 | 0.2735 | -1.75×10⁻³ | 0.64 |
| 105 | 15 | 90 | 100 | 0.2705 | 0.2643 | 6.15×10⁻³ | 2.27 |
| 106 | 15 | 90 | 200 | 0.2721 | 0.2682 | 3.94×10⁻³ | 1.45 |
| 107 | 15 | 90 | 300 | 0.2831 | 0.2856 | -2.45×10⁻³ | 0.87 |
| 108 | 15 | 90 | 600 | 0.3269 | 0.3267 | 2.47×10⁻⁴ | 0.08 |
| 109 | 15 | 120 | 3 | 0.1477 | 0.1492 | -1.43×10⁻³ | 0.96 |
| 110 | 15 | 120 | 6 | 0.1522 | 0.1512 | 9.50×10⁻⁴ | 0.62 |
| 111 | 15 | 120 | 100 | 0.1475 | 0.1562 | -8.63×10⁻³ | 5.85 |
| 112 | 15 | 120 | 200 | 0.1701 | 0.1675 | 2.55×10⁻³ | 1.50 |
| 113 | 15 | 120 | 300 | 0.1867 | 0.1886 | -1.83×10⁻³ | 0.98 |
| 114 | 15 | 120 | 600 | 0.2356 | 0.2342 | 1.37×10⁻³ | 0.58 |
| 115 | 15 | 150 | 3 | 0.0909 | 0.0854 | 5.53×10⁻³ | 6.09 |
| 116 | 15 | 150 | 6 | 0.0870 | 0.0862 | 7.36×10⁻⁴ | 0.85 |
| 117 | 15 | 150 | 100 | 0.0984 | 0.0989 | -5.46×10⁻⁴ | 0.55 |
| 118 | 15 | 150 | 200 | 0.1156 | 0.1137 | 1.92×10⁻³ | 1.66 |
| 119 | 15 | 150 | 300 | 0.1325 | 0.1355 | -2.96×10⁻³ | 2.23 |
| 120 | 15 | 150 | 600 | 0.1827 | 0.1844 | -1.67×10⁻³ | 0.92 |
To gain a further insight into the relation between deviation and variables, deviation distributions with respect to T, P, and γ is investigated. All of the results are presented in Fig. (2).
 |
Fig. (2). Box plots of error percentage vs. P, T, and γ, respectively, for the RDR models, where the 10th, 25th, 50th, 75th, and 90th percentile of deviation dataset are marked. |
Fig. (2) compares distribution of deviation data related to P for the RDR models. Here, the key percentiles of deviation dataset are marked in box plots. It can be readily found that the extreme deviation is about 11%, and 99% deviation are less than 11%, reflecting excellent prediction for the RDR model. Besides, the median line at 100MPa is slightly higher than others, which suggests that the predictive accuracy at 100MPa is lower than others. The fact that the deviation area of 85MPa exhibits slightly larger means a larger error distribution.
In Fig. (2), the distribution of error percentage vs. T is offered. It is clear that the extreme deviation appears at 150oC, and the highest median line at 60oC. Meanwhile, the deviation area is longer at 60oC than others. These results show that the predictive accuracy is slightly lower at 60oC than any others.
In addition, Fig. (2) gives box plots of the distribution of error percentage vs. γ. One readily finds that the extreme deviation appears at 3rpm, and the high median lines appear at 3 and 6rpm. This finding reveals that the predictive accuracy should be worse at low shear rates than those at high shear rates. That is to say, the established model does not always accurately predict the measured shear stresses at low shear rates.
According to deviation analysis given above, the RDR model defined for water-based drilling fluid has a low predictive error less than 11.7%. Although large errors occur at high pressure and low shear rates, they meet requirement of predictive accuracy on-site. It can be reasonably concluded that an accurate HTHP rheological model is established for the sulphonated water-based drilling fluid considered here.
CONCLUSION
Developing an accurate HTHP rheology model is complex for drilling fluids, due to the involvement of multiple variables. In the present work, the RDR experiment was conducted on the weighted sulphonated water-based drilling fluid applied in Southwest China Gas Fields, to establish an accurate HTHP rheology model at six specific shear rates(3-600rpm) under certain temperature(30-150°C) and pressure(0.1-150MPa) conditions. The predictive deviation was examined to evaluate applicability of RDR approach in HTHP rheological modeling for the sulphonated water-based drilling fluid.
The modeling procedure was discussed in detail for the purpose of validating RDR application. The determined HTHP rheological equation has a lower predictive deviation(˂11.7%), illustrating that it can relate dial readings with shear rate, temperature, and pressure very well. The larger errors readily happen at high pressure and low shear rates. This work not only develops the highly accurate HTHP rheological equation for the weighted sulphonated water-based drilling fluid, but also validates RDR application in the field of HTHP rheological modeling of drilling fluids. As an excellent modeling tool, the RDR approach can be extended to other drilling fluids, which would have large application potential in the future.
CONSENT FOR PUBLICATION
Not applicable.
CONFLICT OF INTEREST
The authors declare no conflict of interest, financial or otherwise.
ACKNOWLEDGEMENTS
The authors thank the Scientific Research Foundation of ZJOU (Project No. Q1510), Training Project Foundation of ZJOU, National Science and Technology Major Project(No. 2016ZX05060-015) and the Nature Science Foundation of China(Project No. 11472246) for financial support.