RESEARCH ARTICLE
Research on Gas-liquid Mixed Transportation Technological Adaptability: A Case Study of the Western Sichuan Gas Field
Qingsha Zhou1, *, Kun Huang1, Yongchun Zhou2
Article Information

Identifiers and Pagination:
Year: 2017Volume: 10
First Page: 37
Last Page: 47
Publisher Id: TOPEJ-10-37
DOI: 10.2174/1874834101701010037
Article History:
Received Date: 10/06/2016Revision Received Date: 03/1/2017
Acceptance Date: 16/01/2017
Electronic publication date: 13/03/2017
Collection year: 2017
open-access license: This is an open access article distributed under the terms of the Creative Commons Attribution 4.0 International Public License (CC-BY 4.0), a copy of which is available at: https://creativecommons.org/licenses/by/4.0/legalcode. This license permits unrestricted use, distribution, and reproduction in any medium, provided the original author and source are credited.
Abstract
Background:
The western Sichuan gas field belongs to the low-permeability, tight gas reservoirs, which are characterized by rapid decline in initial production of single-well production, short periods of stable production, and long periods of late-stage, low-pressure, low-yield production.
Objective:
It is necessary to continue pursuing the optimization of transportation processes.
Method:
This paper describes research on mixed transportation based on simplified measurements with liquid-based technology and the simulation of multiphase processes using the PIPEPHASE multiphase flow simulation software to determine boundary values for the liquid carrying process.
Conclusion:
The simulation produced several different recommendations for the production and maximum multiphase distance along with difference in elevation. Field tests were then conducted to determine the suitability of mixed transportation in western Sichuan, so as to ensure smooth progress with fluid metering, optimize the gathering process in order to achieve stable and efficient gas production, and improve the economic benefits of gas field development.
1. INTRODUCTION
The Western Sichuan gas field is characterized by a dramatic decreasing production as well as considerable fluctuations in the water yield [1]. In order to guarantee metering precision, the volume of gas produced is often metered after gas-liquid separation. However, gas-liquid separation can be avoided by using a wet gas measurement system, which both simplifies the construction of gas stations and improves the efficiency of the gas gathering process [2]. It is also beneficial in enhancing the economic efficiency of gas field development [3]. Research on the adaptability of two-phase gas-liquid transmission based on the simplifying process of wet gas metering has been carried out. Experimental studies of wet gas metering have attempted to simplify the process and reduce necessary investment and operating expenses. The Sulige gas field and the Sichuan Petroleum Administrative Bureau (SPAB; affiliated with the China National Petroleum Corporation) separately conducted liquid-gas metering experiments on typical gas wells in 2005 and between 2007 and 2008, and both obtained accurate metering data of gas volume and increased economic benefits. Since then, the wet gas metering system has become wide spread in the Sulige gas field, and SPAB has used 982 vortex precession flow meters for gas metering in its gas fields [4, 5]. Researchers at the Kela 2 gas field determined the feasibility of two-phase transportation by using PIPESYS and ProFES–Transient(special two-phase software) to conduct steady and dynamic simulations [6]. Two-phase transportation has also been successfully applied in the PetroChina-Shell Changbei Gas Project in the Changqing oil field, the largest onshore joint development project in China. This project’s surface gathering process is characterized by multi-well cluster gas collection, heating before operation, mid-pressure gathering, gas-liquid delivery, and wellhead metering [7]. After many years of practice, decision makers for the Daqing and Zhongyuan oil fields concluded that vortex precession flow meters are preferred over wet gas metering instruments. Watanabe [8] studied the two-phase flow with particle simulations and developed a parallel molecular dynamics simulation code which is capable up to ten thousand processes. Chen [9] couple pseudo-particle modeling, a variant of hard-particle molecular dynamics, with standard soft-particle molecular dynamics to study an idealized gas-liquid flow in nano-channels. Thomas Frank described the need for multiphase flow modeling in industrial flow simulations in dependence on the encountered flow regimes and conditions, and studied the applications and validation for the presented model formulations [10].
Consequently, tests are required to verify the feasibility of applying vortex precession flow meters in the western Sichuan gas field, where wet gas metering is practical. Field tests and simulations of gas-liquid transmission using software have been conducted in order to ensure the feasibility of two-phase transportation in the Western Sichuan gas field.
2. FEASIBILITY OF GAS-LIQUID TRANSPORTATION
A wet gas metering system operates without a separator in the wellhead and can produce valid gas volume measurements, thereby simplifying the gas gathering and transportation process. Because wet gas involves a multiphase flow known as anisotropy, tremendous differences exist between various fluid patterns in terms of phase distribution and hydro dynamics; this creates great difficulty in the accurate metering of gas volume. As wet gas introduces multiphase flow in pipeline transportation, variations in the gas water ratio and elevation obviously impact the formation of hydrate and pressure loss [11, 12]. For this reason, the key points to consider in determining the process of liquid-gas transportation are as follows: guaranteeing that hydrate does not form in the pipeline under conditions of wet gas transmission; guaranteeing that pressure loss remains within a specified acceptable level; and controlling changes in elevation.
2.1. Basic Conditions of Gas Gathering and Transportation
Across all the gas fields in China, the liquid-gas transportation technique is often applied in the gas gathering branch line between the gas gathering well site and the gas gathering station. Pipes with diameters of 89 mm and 159 mm are generally used in the gas gathering branch line. Daily gas transmission volume is usually less than 100,000 m3. Because the length of pipeline is comparatively short, usually 3 to 5 km, the mixed transportation technique does not create much pressure loss. Pipe pigging and drainage must be done regularly to discharge the hydrops that form easily in mixed transmission; however, this has little impact on the gathering volume of the entire gas field on account of the tiny throughput of a single pipeline [13].
2.1.1. Gas Composition
The data in Table 1 show that methane constitutes a significant majority(over 90%) of the components of the feed gas in the western Sichuan gas field. Carbon dioxide at around 0.5% and nitrogen at around 2% are small factors in the feed gas. A small portion of gas condensate and water also exists in natural gas, which contains no hydrogen sulfide. Since the component contents of natural gas are almost the same across different gas fields in the western Sichuan region, this paper takes the composition of the Xinchang area of the western Sichuan gas field as an example.
| Field No. | C1/(%) | C2/(%) | C3/(%) | i-C4/(%) | n-C4/(%) | i-C5/(%) | n-C5/(%) | C5+/(%) | CO2/(%) | N2/(%) | He/(%) |
|---|---|---|---|---|---|---|---|---|---|---|---|
| 1 | 93.1 | 3.34 | 0.71 | 0.15 | 0.157 | 0.199 | 0.73 | 0.06 | 0.34 | 1.25 | 0.04 |
| 2 | 92.7 | 4.14 | 0.78 | 0.16 | 0.166 | 0.116 | 0.35 | 0.05 | 0.39 | 1.12 | 0.01 |
| 3 | 94 | 2.45 | 0.47 | 0.096 | 0.101 | 0.042 | 0.03 | 0.02 | 0.52 | 2.1 | 0.02 |
| 4 | 93.5 | 3.23 | 0.77 | 0.178 | 0.184 | 0.189 | 0.61 | 0.1 | 0.31 | 1.36 | 0.01 |
| 5 | 90.51 | 4.15 | 1.05 | 0.237 | 0.264 | 0.11 | 0.07 | 0.06 | 0.59 | 2.85 | 0.06 |
2.1.2. Vapor-Liquid Ratio
According to the statistics for producing gas-wells in western Sichuan, 83% of gas wells have an average production below 10,000 m3 per day for a single well, which is relatively small in terms of gas production. Moreover, there is an 86.3% gas well with a water-air ratio less than 10m3 water per 10,000 m3 gas, which can be used as the minimum vapor-liquid ratio in simulations. Meanwhile, the loss of pressure is controlled at 0.11 MPa/km, a value that previous simulation experiments have determined can be used to estimate pressure as the convergence condition in simulations. Therefore, in order to consider the production status of most gas fields in western Sichuan, simulation parameters need to be controlled as follows: vapor-liquid ratio,10m3water per 10,000 m3 gas; pressure loss, less than 0.11 MPa/km.
2.1.3. Pressure
The gathering and transportation pipe network in the western Sichuan gas field can be divided into three different sets of systems on the basis of pressure rank: intermediate pressure systems(1.3-3.5 MPa), low pressure systems(0.5-0.8 MPa), and pressurization systems(0.3-0.5 MPa). Statistics suggest that the pressure systems can be further subdivided into four pressure ratings: the intermediate pressure network(1.6 MPa) in the Xinchang maturing area, the intermediate pressure network(2.5 MPa) in the new Zhongjiang-Gaomiao area, the low pressure network (0.7 MPa) in the Xinchang maturing area, and the pressurization network (0.4 MPa) in the Xinchang maturing area.
2.1.4. Pipeline Specifications
Based on the experience of mixed transportation in other domestic gas fields, a gas-liquid transmission pipeline should be part of a gathering branch line. In this area, the diameters of gas gathering branch lines are usually 89 mm and 159 mm. The length of the pipe often ranges from 0.5 to 5 km.
2.2. Model Analysis of Mixed Transmission
Because gas and liquid are transported together, the fluid in the pipe embodies multiphase fluid movement. Therefore, we used PIPEPHASE, simulation software for multiphase fluids, to simulate the flow process [14, 15].
2.2.1. Impact of Vapor-Liquid Ratio
First of all, the results of the simulation (shown in Tables 2 and 3) demonstrated that a small amount of hydrops always remains in the pipeline no matter how the ratio changes.
| Droplet content /(m3/d) | Transmitting volume /(m3/d) | Gas-liquid ratio | Hydrops condition /(m3/km) |
|---|---|---|---|
| 5 | 5×10⁴ | 104 m3gas/1 m3water | 0.078 |
| 5 | 10×104 | 104m3gas/0.5 m3water | 0.066 |
| 2 | 10×104 | 104m3gas/0.2 m3water | 0.036 |
| Droplet content/(m3/d) | Transmitting volume /(m3/d) | Gas-liquid ratio | Hydrops condition /(m3/km) |
|---|---|---|---|
| 0.5 | 0.5×10⁴ | 104 m3gas/1 m3water | 0.141 |
| 5 | 5×10⁴ | 104 m3gas/1 m3water | 0.078 |
We can be sure that a certain amount of hydrops will remain in the pipes if the gas contains liquid, because it is inevitable that water will accumulate in the pipes during wet gas transportation. As the gas-liquid ratio increases, the quantity of hydrops rises while the liquid holdup decreases. Through such simulations, we can determine that the status of pipeline hydrops differs due to differences in gas volume and droplet content under the same gas-liquid ratio conditions.
Because of the different gas volumes and water contents, the liquid carrying situations in the pipes differ even under the same gas-liquid ratio. The presence of water narrows the pipe’s flow area, which reduces transport efficiency. Therefore, pigging needs to be conducted regularly during mixed transportation. Statistics show that nearly 90% of gas wells have a gas-liquid proportion less than 104 m3 gas/10 m3 water. The ratio often fluctuates in actual situations. Because of the intermittent water yield, the proportion can sometimes reach 104 m3 gas/10 m3 water for some gas wells with low water-output. Therefore, the condition of 104 m3 gas/10 m3 water is used in this simulation.
2.2.2. Hydrate Formation
The region is classified as a subtropical mountain evergreen broad-leaved forest. While the soil temperature of subtropical mountain evergreen broad-leaved forests at 5 cm under the surface is at its coldest at 6 °C in January, the distance between the top of the pipeline and the ground surface often ranges from 800 to 1,000 cm. Allowing for the coldest weather conditions, the environmental temperature of 8°C after burying a pipe can be assumed to be slightly higher than the temperature (6 °C) of the soil surface, while the air temperature is assumed to be -4 °C.
The outlet pipeline of a gas recovery facility is laid underground along the gas processing area. As for temperature loss in outdoor pipelines, 12 m medium-pressure pipes in the wet gas metering system are the only component that needs to be taken into consideration. The specification of the pipeline is Φ89×5. Table A (in Appendix) shows the computed results using PIPEPHASE.
As the Table A (in Appendix) shows, the lower the gas volume, the higher the temperature loss of the outdoor pipeline. Finally, the gas temperature will approach the ground’s environmental temperature after being transported out of the station. Therefore, the transmission end temperature is 6 °C. Table 4 shows the condition of hydrate formation under different pressures as determined using HYSYS software.
| Pressure/(MPa) | 0.5 | 2 | 2.5 | 3 | 3.5 | 4 |
| Formation temperature/(°C) | -1.61 | 0.995 | 3.03 | 4.2 | 5.8 | 7.2 |
If the temperature reaches a point suitable to form hydrate in the pipeline, a large amount of ice would form where plenty of liquid exists in the pipeline. As a result, the transmission temperature of gas must be kept 2 to 3 °C higher than the temperature of hydrate formation in order to prevent formation of hydrate in the pipes. As the transmission end temperature remains at 6 °C, the transmission pressure should be controlled under 3 MPa to prevent hydrate formation.
2.2.3. Determination of Pipeline Delivery Distance
Based on the analysis results (see Tables 2 and 5, Table A (in Appendix)), two points must be considered when checking the conveying distances of the pipeline: (1) Calculation is carried out based on the minimum gas-liquid ratio (104 m3gas/10 m3 water), with consideration of some other extreme conditions for producing water. (2) No matter the type of pipeline, transmission pressure should be kept below 3 MPa when wet gas is transported. Therefore, there are four ranges of pipe network pressure, analyzed as follows.
2.2.3.1. Pressurization Pipe Network in the Xinchang Area
The pressure in the pressurization pipe network in the Xinchang area ranges from 0.3 to 0.5 MPa. Gas wells connecting to the pressurization network are low-pressure wells with pressures close to that of the pressurization pipe, with some exceptions. The average pressure of the supercharging network is 0.4 MPa. Counting up and analyzing the productive parameters of low-pressure wells demonstrates that the maximum pressure loss (initial pressure subtracted from network pressure) is approximately 0.16 MPa, which is represented by ΔP. Table B (in Appendix) shows these results.
The Table B (in Appendix) shows that when wet gas is transported from low-pressure wells to the pressurization network, the maximum guaranteed gas volume for delivery when the conveying distance is 550 m is 25,000 m3 per day. When the volume of gas is less than 15,000 m3 per day, the transporting distance can reach 1.5 km. Consequently, most producing requirements of the low-pressure wells in the Xinchang maturing area of the western Sichuan gas field can be satisfied.
2.2.3.2. Low-pressure Pipe Network in the Xinchang Area
Pressures in the low-pressure pipe network in the Xinchang area range from 0.5 to 0.8 MPa. The average pressure of the low-pressure network was set as 0.7 MPa. Counting up and analyzing the production parameters of the low-pressure wells demonstrates that the maximum pressure loss(initial pressure subtracted from network pressure) is approximately 0.48 MPa, which is represented by ΔP. Table C (in Appendix) displays these results.
The Table C (in Appendix) shows that when wet gas is transported into a low-pressure network, the maximum guaranteed gas volume for delivery over a conveying distance within 550 m is 60,000 m3 per day. When the volume of gas is less than 30,000 m3 per day, the transporting distance can reach 2.5 km. Accordingly, most of the production requirements for low-pressure wells in the Xinchang maturing area of the western Sichuan gas field can be met.
2.2.3.3. Medium-Pressure Pipe Network in the Xinchang Area
Pressures in the medium-pressure pipe network in the Xinchang area range from 1.3 to 2.0 MPa. Gas wells connecting to this network are almost all medium-pressure wells with pressures exceeding that of the medium network, with some exceptions. The average pressure is set as 3 MPa for calculation purposes. Counting up and analyzing the production parameters of the medium-pressure wells demonstrates that the maximum pressure loss(initial pressure subtracted from network pressure) is approximately 1.4 MPa, which is represented by ΔP. Table D (in Appendix) displays these results.
The table shows that when wet gas is transported into the medium-pressure network, the maximum guaranteed gas volume for delivery over a conveying distance within 500 m is 170,000 thousandm3 per day. When the volume of gas is less than 80,000 m3 per day, the transporting distance can reach 2.7 km. As a result, almost all of the production requirements of medium-pressure and high-pressure wells in the Xinchang maturing area of the western Sichuan gas field can be met.
2.2.3.4. Medium-Pressure Pipe Network of the Zhongjiang Area
Pressures in the medium-pressure pipe network in the Zhongjiang area range from 2.3 to 3.5 MPa. The geographical environment of the Zhongjiang-Gaomiao district is mountainous, in contrast to conditions in the plain area of Xinchang. The changes in elevation have remarkable and complex impacts on pressure loss, hydrop conditions, and conveying distance.
An analysis of the conditions of transporting pipelines in the Zhongjiang area follows, with divisions based on organizing information. The pipeline between JS 2-1 to JS 2-2 has been selected for detailed analysis due to its relatively small variations in elevation. Likewise, the pipeline between JS 25 to JS 47 has been selected for analysis owing to its comparatively large variations in elevation.
2.2.3.4.1. Simulating Wet Gas Transportation in the JS 25 Station
Two gas wells called JS 25 and JS 32 are connected by a pipe with an external diameter of 159 mm. The straight-line distance of the pipe is 1,950 m. In view of the mountainous landscape of Zhongjiang, the elevation change of the pipe must be taken into consideration. Based on the conditions of the pipe network, the JS 25 station will connect to the JS 47 station, which is not yet operational. As transmission end temperature is unknown, the transporting pressure is predicted to be 3.5 MPa. Based on these data, the operating conditions of pipelines from the JS 25 station are calculated and displayed in Table 5 combined with the transporting pressure of the JS 47 station and different water-gas ratios.
| Water-gas ratio/(×10-4) | P1/(kPa) | P2/(kPa) | T1/(°C) | T2/(°C) | Hydrop content/(m3) |
|---|---|---|---|---|---|
| 0 | 3510.87 | 3500 | 18 | 8.72 | 0 |
| 0.2 | 3772.92 | 3500 | 18 | 8.16 | 1.418 |
| 0.5 | 3907.24 | 3500 | 18 | 7.96 | 2.2 |
| 1 | 4051.96 | 3500 | 18 | 7.69 | 3.072 |
| 1.5 | 4158.99 | 3500 | 18 | 7.57 | 3.654 |
| 7 | 4598.39 | 3500 | 18 | 7.5 | 4.637 |
The transporting pressure is predicted at 2.5 MPa for purposes of calculation. Therefore, the operating conditions of pipelines from the JS 25 station can be simulated and shown in Table 6 in combination with the transporting pressure of the JS 47 station and different water-gas ratios.
| Water-gas ratio/(×10-4) | P1/(kPa) | P2/(kPa) | T1/(°C) | T2/(°C) | Hydrop content /(m3) |
|---|---|---|---|---|---|
| 0 | 2510.7 | 2500 | 18 | 9.512 | 0 |
| 0.2 | 2724.4 | 2500 | 18 | 9.133 | 0.418 |
| 0.5 | 2835.5 | 2500 | 18 | 9.108 | 1.2 |
| 1 | 2995.7 | 2500 | 18 | 9.194 | 2.072 |
| 1.5 | 3145.3 | 2500 | 18 | 9.362 | 2.654 |
| 7 | 3363.1 | 2500 | 18 | 9.662 | 2.7 |
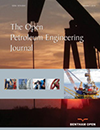
Comprehensive analysis reveals huge differences in elevation of the pipe between JS 25 and JS 47. The pipe travels 200 m uphill (shown in Fig. 1), which would create too much pressure loss if wet gas transport was applied in this area. As Table 6 shows, when the transporting pressure is 3.5 MPa and the water-gas ratio is 0.5m3 water per 10,000 m3 gas, the end pressure (P1) approaches 4 MPa. If the producing water increases continually, the transporting pressure will exceed 4 MPa which cannot be kept safe for production.
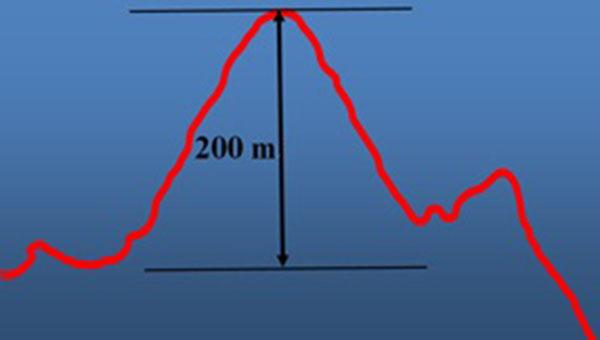 |
Fig. (1). Elevation diagrammatic drawing of JS 25 pipeline. |
2.2.3.4.2. Simulation of Wet Gas Transportation in the JS 2-2 Station
There is only one gas well in the JS 2-2 station, with a pipe of 89 mm external diameter. The straight-line distance of the pipe is 2,417 m. Considering the mountainous landscape of Zhongjiang, the pipe’s elevation changes must be taken into consideration. Based on the conditions of the pipe network, the JS 2-1 station will connect to the JS 2-2 station, which is not yet operational. The transporting pressure is predicted to be 2.5 MPa. Based on these data, the operating conditions of pipelines from the JS 2-2 station can be calculated and displayed in Table 7 in combination with the transporting pressure of the JS 2-1 station and different water-gas ratios.
| Water-gas ratio /(×10-4) | P1/(kPa) | P2/(kPa) | T1/(°C) | T2/(°C) | Hydrop content/m3 |
|---|---|---|---|---|---|
| 0 | 2541.31 | 2500 | 18 | 7.99 | 0 |
| 0.2 | 2591.34 | 2500 | 18 | 7.95 | 0.256 |
| 0.5 | 2606.93 | 2500 | 18 | 7.96 | 0.402 |
| 1 | 2622.25 | 2500 | 18 | 7.93 | 0.564 |
| 1.5 | 2635.48 | 2500 | 18 | 7.95 | 0.681 |
| 7 | 2654.66 | 2500 | 18 | 7.95 | 0.856 |
Since the difference in elevation of the pipeline from JS 2-2 is small, around 54 m at most (as shown in Fig. 2), the pressure loss is relatively small when mixed gas and liquid is transported. In conditions without water, the loss of pressure only increases 0.11 MPa, while the hydrop content is less than 1 cubic meter in a 2,417 m pipe. As a result, the wet gas transportation technique can be safely applied in the JS 2-2 station.
2.2.3.4.3. Check Computation of Mixed Transporting Distance in Mountainous Area of Zhongjiang
The above analysis demonstrates that elevation has remarkable effects on mixed transport. As mentioned above, the maximum difference in pipe elevation in Zhongjiang is 200 m. Therefore, checking calculations for transporting distance are carried out based on the maximum altitude of 200 m and the maximum angle of inclination of 45 degrees. Table E (in Appendix) displays the results.
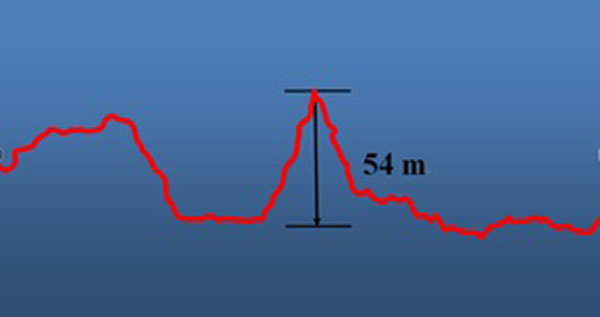 |
Fig. (2). Elevation diagrammatic drawing of JS 2-2pipeline. |
The data (Table E (in Appendix)) demonstrate that the pipe’s conveying capacity rises at first and then falls in the mountainous area. The ability to incorporate water is poor when gas volume is comparatively small, which brings about great pressure losses with ascending elevation. With increases in both gas volume and height, the ability to incorporate water rises while the pressure loss decreases. However, the whole pressure loss still starts increasing at some point, and then falls with the growth of gas volume.
Consequently, delivery capacity rises initially and then falls. The transporting distance reaches only 2.2 to 5.2 km when the gas transmission volume ranges from 10,000 to 30,000 m3 each day, with a 200 m difference in pipeline elevation. Unfortunately, the transmission volume in the Zhongjiang area is between 30,000 and 100,000 m3 each day, and the transporting distance ranges from 1 to 3 km. Therefore, it is difficult to satisfy transporting requirements with a 200 m difference in pipeline elevation.
The transporting distance in a mountainous area of Zhongjiang is computed under the condition of a 3 km transporting distance, with elevation considered. Table F (in Appendix) displays the results.
The Table F (in Appendix) shows that transmission volume can reach 60,000 m3 each day at most to meet a certain pipe elevation. In addition, the maximum elevation difference allowed is 100 m, when the shipping distance ranges from 1 to 3 km and transmission volume is between 30,000 and 100,000 m3 each day.
3. FIELD TESTING GAS-LIQUID MIXED TRANSMISSION
To verify the feasibility of mixed transmission in the western Sichuan gas field, we planned a testing program for use in experiments on several stations. The regular procedures include a bypass pipe linked to a group valve in front of the separator. The units of the PIG transmitter-receiver whose norminal diameter is 80 mm should be set up ahead of the next in-station group valve, in order to conveniently evaluate the conditions of hydrops in the pipe.
 |
Fig. (3). Diagrammatic drawing of experiment flow. |
To ensure safety, the mixed transmission system and the regular system are applied simultaneously (as shown in Fig. 3). A bypass pipe linked to the regular flow will be removed after the stabilization of production. The units of the PIG transmitter-receiver are installed at both the out-station and the in-station of all test stations to prevent the problem presented by ice blocks.
CONCLUSION
- When the volume of gas for delivery is less than 15,000 m3 per day, the transporting distance can reach 1.5 km. Consequently, most of the production requirements for low-pressure wells in the Xinchang maturing area of the western Sichuan gas field can be satisfied. When wet gas is transported into a low-pressure network, the transporting distance can only reach 2.5 km if the volume of gas for delivery is less than 30,000 m3 each day. When wet gas is shipped into a medium-pressure network, the transporting distance can only reach 2.7 km if the volume of gas for delivery is less than 80,000 m3 each day. As a result, almost all of the production requirements for medium-pressure and high-pressure wells in the Xinchang maturing area of the western Sichuan gas field can be met. In summary, the mixed transportation system is feasible for plain areas like Xinchang.
- A 200m difference in elevation exists along the pipe between JS 25 and JS 47,which means that there would be too much pressure loss if wet gas transport were applied in this area. Since the difference in pipeline elevation from JS 2-2 is small, around 54 m at most, the pressure loss is relatively small and the hydrop content is less than 1 m3when mixed gas and liquid is transported. Therefore, the wet gas transportation technique can be applied at the JS 2-2 station. In the mountainous area of Zhongjiang, wet gas transmission can be applied when the transporting pressure is less than 3 MPa, the water-gas ratio is less than 3 m3 water per 10,000 m3 gas, and the difference in elevation is less than 100 m.
Similar research should be conducted in more detail in order to consider various practical limits such as inclination angle of pipe, gas volume, etc. Additional field tests should assess typical gas wells in conjunction with simulation research. The technique of two-phase transportation can be extended to other gas fields with similar conditions to those in the western Sichuan gas field, and the application of this method can cut costs and enhance the economic efficiency of gas field development.
APPENDIX
| Gas volume | Wellhead temperature | Outbound temperature | Transmission end temperature |
|---|---|---|---|
| (×104m3/d) | (°C) | (°C) | (°C) |
| 0.05 | 20 | 3.954 | 6 |
| 0.1 | 20 | 7.214 | 6 |
| 0.3 | 20 | 12.23 | 6 |
| 0.5 | 20 | 14.23 | 6 |
| 0.8 | 20 | 15.64 | 6 |
| 1 | 20 | 16.21 | 6 |
| 1.5 | 20 | 16.96 | 6 |
| 2 | 20 | 17.35 | 6 |
| 2.5 | 20 | 17.59 | 6 |
| 3 | 20 | 17.78 | 6 |
| 4 | 20 | 18.67 | 6 |
| 5 | 20 | 18.96 | 6 |
| 6 | 20 | 19.12 | 6 |
| 7 | 20 | 19.22 | 6 |
| 8 | 20 | 19.29 | 6 |
| 9 | 20 | 19.34 | 6 |
| 10 | 20 | 19.39 | 6 |
| Delivering volume | Conveying distance/(m) | Network pressure | Initial pressure | Pressure loss |
|---|---|---|---|---|
| (×104m3/d) | (MPa) | (MPa) | (MPa) | |
| 0.05 | 10000 | 0.4 | 0.4019 | 0.0019 |
| 0.1 | 10000 | 0.4 | 0.4065 | 0.0065 |
| 0.3 | 10000 | 0.4 | 0.4418 | 0.0418 |
| 0.5 | 10000 | 0.4 | 0.5188 | 0.1188 |
| 0.8 | 5500 | 0.4 | 0.5541 | 0.1541 |
| 1 | 3900 | 0.4 | 0.5662 | 0.1662 |
| 1.5 | 1600 | 0.4 | 0.5603 | 0.1603 |
| 2 | 900 | 0.4 | 0.5668 | 0.1668 |
| 2.5 | 550 | 0.4 | 0.5621 | 0.1621 |
| 3 | 400 | 0.4 | 0.5605 | 0.1605 |
| Delivering volume | Conveying distance/(m) | Network pressure | Initial pressure/(MPa) | Pressure loss |
|---|---|---|---|---|
| (×104m3/d) | (MPa) | (MPa) | ||
| 0.1 | 10000 | 0.7 | 0.7039 | 0.0039 |
| 0.5 | 10000 | 0.7 | 0.7638 | 0.0638 |
| 0.8 | 10000 | 0.7 | 0.8719 | 0.1719 |
| 1 | 10000 | 0.7 | 0.9504 | 0.2504 |
| 1.5 | 10000 | 0.7 | 1.1809 | 0.4809 |
| 2 | 5700 | 0.7 | 1.1807 | 0.4807 |
| 3 | 2500 | 0.7 | 1.1821 | 0.4821 |
| 4 | 1200 | 0.7 | 1.1712 | 0.4712 |
| 5 | 850 | 0.7 | 1.1839 | 0.4839 |
| 6 | 550 | 0.7 | 1.1732 | 0.4732 |
| Delivering volume | Conveying distance/(m) | Network pressure | Initial Pressure | Pressure loss/(MPa) |
|---|---|---|---|---|
| (×104m3/d) | (MPa) | (MPa) | ||
| 0.5 | 10000 | 1.6 | 1.6336 | 0.0336 |
| 1 | 10000 | 1.6 | 1.7036 | 0.1036 |
| 2 | 10000 | 1.6 | 2.0376 | 0.4376 |
| 3 | 10000 | 1.6 | 2.4614 | 0.8614 |
| 4 | 10000 | 1.6 | 2.9661 | 1.3661 |
| 5 | 7000 | 1.6 | 3.0571 | 1.4571 |
| 6 | 5000 | 1.6 | 3.0802 | 1.4802 |
| 7 | 3500 | 1.6 | 3.0246 | 1.4246 |
| 8 | 2700 | 1.6 | 3.0386 | 1.4386 |
| 9 | 2100 | 1.6 | 3.0266 | 1.4266 |
| 10 | 1700 | 1.6 | 3.0338 | 1.4338 |
| 12 | 1100 | 1.6 | 2.9915 | 1.3915 |
| 15 | 700 | 1.6 | 2.9935 | 1.3935 |
| 17 | 500 | 1.6 | 3.0142 | 1.4142 |
| Gas volume | Conveying distance/(m) | Network pressure | Initial pressure | Pressure loss |
|---|---|---|---|---|
| (×104m3/d) | (MPa) | (MPa) | (MPa) | |
| 0.5 | 200 | 2.5 | 3.0028 | 0.5028 |
| 1 | 5200 | 2.5 | 2.9951 | 0.4951 |
| 2 | 3200 | 2.5 | 2.9991 | 0.4991 |
| 3 | 2200 | 2.5 | 3.0208 | 0.5208 |
| 4 | 1500 | 2.5 | 3.0272 | 0.5272 |
| 5 | 1200 | 2.5 | 3.0468 | 0.5468 |
| 6 | 700 | 2.5 | 3.0113 | 0.5113 |
| 7 | 1000 | 2.5 | 3.0289 | 0.5289 |
| 8 | 900 | 2.5 | 3.0168 | 0.5168 |
| 9 | 700 | 2.5 | 3.0091 | 0.5091 |
| 10 | 550 | 2.5 | 3.0037 | 0.5037 |
| Conveying distance | Rising height | Gas volume | Network pressure | Initial pressure | Pressure loss |
|---|---|---|---|---|---|
| (m) | (m) | (×104m3/d) | (MPa) | (MPa) | (MPa) |
| 3000 | 0 | 6.5 | 2.5 | 3.0103 | 0.5103 |
| 3000 | 30 | 6 | 2.5 | 3.0637 | 0.5637 |
| 3000 | 50 | 5 | 2.5 | 2.9789 | 0.4789 |
| 3000 | 60 | 4.5 | 2.5 | 3.0163 | 0.5163 |
| 3000 | 80 | 4 | 2.5 | 3.0367 | 0.5367 |
| 3000 | 100 | 3 | 2.5 | 3.0452 | 0.5452 |
| 3000 | 150 | 2 | 2.5 | 3.0442 | 0.5442 |
| 3000 | 180 | 0.5 | 2.5 | 3.1596 | 0.6596 |
| 3000 | 198 | 1 | 2.5 | 3.0916 | 0.5916 |
| 3000 | 200 | 2 | 2.5 | 2.9991 | 0.4991 |
CONFLICT OF INTEREST
The authors confirm that this article content has no conflict of interest.
ACKNOWLEDGEMENTS
Declared none.