
RESEARCH ARTICLE
Using a New Magnetic Flux Leakage Method to Detect Tank Bottom Weld Defects
Wei Cui*, Hai-yan Xing, Min-zheng Jiang, Jian-cheng Leng
Article Information

Identifiers and Pagination:
Year: 2017Volume: 10
First Page: 73
Last Page: 81
Publisher Id: TOPEJ-10-73
DOI: 10.2174/1874834101710010073
Article History:
Received Date: 04/04/2016Revision Received Date: 09/11/2016
Acceptance Date: 23/11/2016
Electronic publication date: 31/03/2017
Collection year: 2017
open-access license: This is an open access article distributed under the terms of the Creative Commons Attribution 4.0 International Public License (CC-BY 4.0), a copy of which is available at: https://creativecommons.org/licenses/by/4.0/legalcode. This license permits unrestricted use, distribution, and reproduction in any medium, provided the original author and source are credited.
Abstract
Background:
The weld is an important connection part of the tank bottom but during the process of manufacturing and through its use, it frequently produces defects and brings serious hidden danger in the process of safety production.
Objective:
This paper develops a new magnetic flux leakage testing system for tank bottom weld defects and proposes an extraction method for the weld defect. It can be used in the detection and visual evaluation of the weld defects.
Method:
A continuous non-contact scanning method is used in the rectangular slot defect in the different regions of the weld by using a new magnetization system that is vertical to the travelling direction. The characteristics of the weld and the defect are transformed into accurate two-dimensional grayscale graphics through grayscale linear transformation. This is done through the combination of histogram equalization, Otsu’s method of binaryzation, morphologically removing small objects, edge detection, and then structuring a morphologically optimized edge extraction algorithm for edge detection on the grayscale. The displayed grayscale outline locates and quantifies the defects.
Conclusion:
The results indicated that this method can directly indicate the defect shape, location and other information, the visual display of the magnetic flux leakage testing of the weld defects was also realized. It solved difficulties associated with the magnetic flux leakage method being used in the weld testing and showed how weld detection equipment can be used in the detection and visual evaluation of the weld defects.
1. INTRODUCTION
Liquid tanks are used in oil depots and ports and are important for the storage of petrochemical raw materials and intermediate products. The tank bottom plate located in the tank bottom, is susceptible to corrosion, and is in contact with the storage medium. The weld is an important connection part of the tank bottom but during the process of manufacturing and through its use, it produces defects. The weld defects usually occur in the weld fusion zone along the border of the heat affected zone and the weld. Because these areas have a geometric discontinuity and similar mechanical properties and can have a concentration of stress, the area under the joint action of medium pressure is susceptible to stress, corrosion cracking, and induced cracks. Therefore, carrying out efficient detection of the weld defects on the tank bottom to ensure the normal use of the tank has safety and economic significance.
At present, methods such as radiographic testing, ultrasonic testing, and magnetic memory testing [1-4] are used for online inspection of the weld. Research on the magnetic flux leakage (MFL) method for testing weld defects has shown that this method is easy to carry out [5, 6] and reports demonstrate that MFL detection of weld defects is technically feasible but there is a lack of weld detection instruments and recognition of quantitative analysis of the weld defects. The two key technical problems associated with the MFL method for testing for the weld defects are; the structural characteristics of the weld (which means that the magnetization direction parallel to the travelling direction of the detection system is no longer available) and, when using MFL in the detection of the weld defect, the MFL signal generated by the weld contour is superimposed on the defect signal. These technical problems lead to limitations in the traditional signal processing for the detection and visual identification of the weld defects. This paper provided solutions to these two problems by developing a system so that the magnetization direction is vertical to the travelling direction, which resolved the first problem, and the second problem of quantitative visual identification of the weld defects was addressed with the help of image-processing technology.
2. EXPERIMENT SYSTEM AND RESEARCH
The magnetization direction is parallel to the travelling direction in the traditional detection system, but due to different characteristics of the weld structure, the traditional detection system model is no longer applicable. Therefore, this paper, discussed a new detection system in which the travelling direction of the MFL detector is rotated 90° to make it vertical to the travelling direction. The proposed MFL testing system is similar to a scan along the longitudinal direction to detect longitudinal defects in the pipelines. To expand the range of measurement, the Hall element method has been arrayed to test the leakage of the magnetic field. The Hall sensor array (SS459A) is composed of ten sensors. Due to the change in the direction of the magnetization relative to the travelling direction, the Hall element array designed to test the new system also changes accordingly; the schematic diagram of which is shown in Fig. (1). A spring servo structure of detection probe has been adopted to ensure that the probe is placed close to the tested steel plate and weld. The continuous non-contact scanning MFL system for the weld is composed of the magnetic structure, signal acquisition system, and the drive structure. The magnetic structure is composed of armature, pole shoe, and the magnet. The signal acquisition system is composed of Hall sensor, encoder, data acquisition card, and computer. The hand lever is the driving structure of the system, and the continuous non-contact scanning MFL system for the weld is shown in Fig. (2).
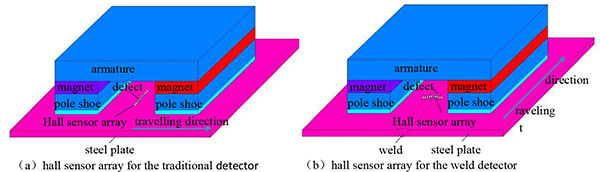 |
Fig. (1). Diagram of Hall sensor array. |
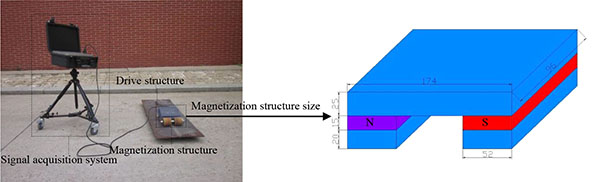 |
Fig. (2). Continuous non-contact scanning MFL system for the weld. |
Because cracks are the main defects that impact the weld’s mechanical properties, in many weld defects, precast rectangular slot defects are used to simulate the crack defect on the experimental plate and analyse distribution characteristics of the rectangular slot defect in different areas (in the weld and in the fusion zone). As the service life of the weld and the steel plate is directly related to the depth of rectangular slot defect, the variation of the characteristics of the MFL image of the rectangular slot defect is researched from the geometrically transformation of the one-way depth direction (the size is unchangeable in other direction). The precast depth rectangular slot defect in the Q235 test board, which is shown in Fig. (3), had the following dimensions: length 1500 mm, width 400 mm, thickness 8 mm, weld reinforcement 3 mm, and weld width 18 mm. The space between the adjacent precast rectangular slot defect was140 mm, in order to make sure that the slot defects did not affect each other. In 1#-8# rectangular slot length × width = 40 mm × 1 mm, but the depth kept on changing . The depth of 1#-4# defects (in the weld) was respectively 4.6, 6.2, 7.8, and 9.4 mm (calculated by the sum of the weld reinforcement of 3 mm and achieved 20%, 40%, 60%, and 80% thickness of the steel plate, respectively). The depth of 5#-8# defects (in the fusion zone) was 1.6, 3.2, 4.8, and 6.4 mm (with 20%, 40%, 60%, and 80% thickness of the steel plate, respectively).
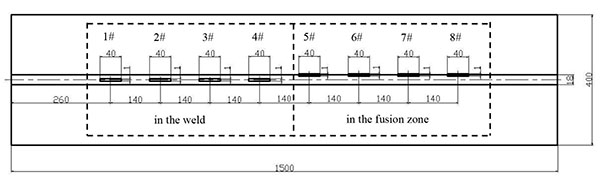 |
Fig. (3). Diagram of the defect distribution of the Experimental board. |
MFL signals have two directions: horizontal and vertical. Due to the vertical component By, the leakage magnetic field is only minimally affected by the magnetic pole, and the analysis of leakage magnetic fields is based on the vertical component of leakage magnetic field in this paper. The distance between the two poles and the air gap between the pole shoe and the steel plate lead to some magnetic force lines from the N pole approximately parallel to the plate directed towards the S pole. As the extracted magnetic flux density Bx of the leakage magnetic field is in this direction, by which it is affected largely. Using the detection system shown in Fig. (2), the vertical component of 3D maps of the MFL signals under the three states was calculated, as shown in Fig. (4).
As seen in Fig. (4) the weld signal superimposed on the defect signal leads to the rectangular slot defect in the weld (Fig. 4b). It has more of a peak and trough than that of in the weld, that is the peak and trough channel resulting from defects. When the rectangular slot defects are in the fusion zone, due to the location of the defects, the trough channel of the weld is superimposed on the trough channel of the defects (Fig. 4c), there is one more peak comparing with that of only existing weld, the peak here, that is, the peak channel of the defects. Under the premise of a certain scanning direction, wave shape, peak and trough valley of MFL signals for the defect in the weld and the weld itself appears in different order, the trough appears firstly, then the peak for the weld itself, the defect in the weld is the opposite.With the weld, first, there is a trough and then a peak, but with the defect, the order is opposite. The distribution of signal acquisition through this experiment has been consistently shown in the literature [7, 8], including the numerical analysis adopted in this paper. Accordingly, this study qualitatively identified the weld and the defect, and determined whether there were any defects in the weld.
3. EDGE DETECTION ALGORITHM BASED ON MATHEMATICAL MORPHOLOGY FOR THE WELD DEFECTS
The commonly used edge detection operators include Sobel edge and Canny edge operators. Each detection operator has its own advantages, disadvantages, and limitations. The literature [9, 10] indicated that mathematical morphology is the new theory and the new method for digital image processing and recognition, and a complete set of system theory, method and algorithm has been developed to describe the basic characteristics of images, while the traditional numerical modelling and analysis, based on the set to analyse signals has been abandoned. Advantages include strong anti-interference; effective noise suppression, and widely applicable images. Focusing on the weld defect MFL images in this paper, mathematical morphology method was used for image edge detection and visual display.
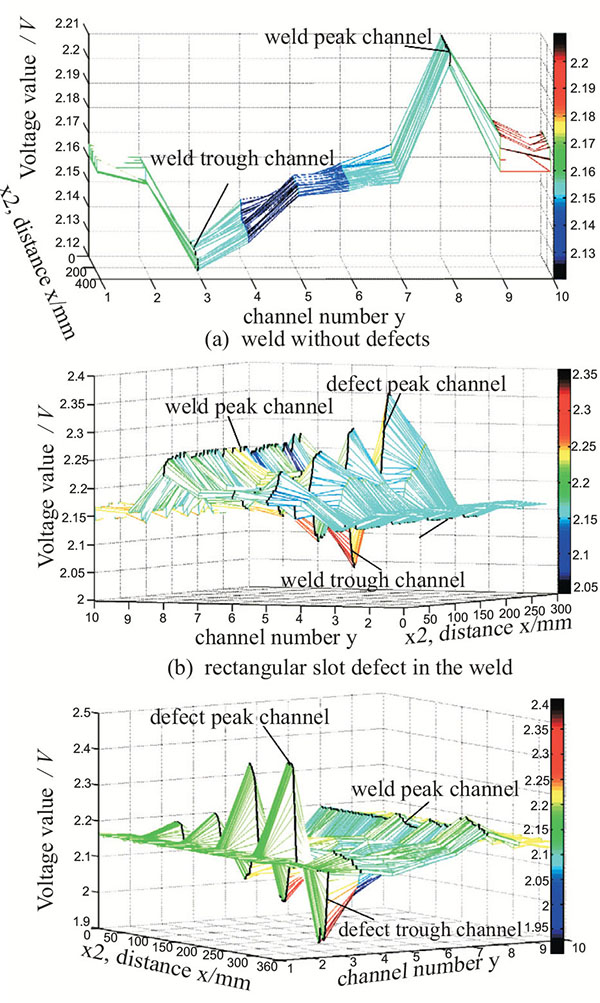 |
Fig. (4). 3D maps of MFL signal under the three states. |
3.1. Basic Operations of Mathematical Morphology
The basic idea of mathematical morphology is to select appropriate structure elements as a basic tool to detect and extract image features. Mathematical morphology defines the two basic operations of dilation and erosion, with other operations based on a mix of these two operations. Based on the above morphological operation, there are three typical kinds of morphological edge detection operators. (Assuming that A is the original image, and S is the structural element. The original image A is eroded by the structural element S as AΘS, and dilated by the structural element S as
 with E being the image edge).
(1) Outer edge extraction algorithm (dilation edge detection):
 |
(1) |
(2) Inner edge extraction algorithm (erosion edge detection):
 |
(2) |
(3) Riding edge (morphological gradient) extraction algorithm (dilation and erosion edge detection):
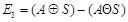 |
(3) |
Therefore, an edge detection operator based on mathematical morphology is a kind of nonlinear differential operator. The detected edge is associated with the structural elements S. According to the gray image characteristics, influence of the detection accuracy, and according to the experience and interactive experiment, the paper selected 3 × 3 matrix structure element in which the detection effect is the most ideal, as follows:
 |
(4) |
3.2. Edge Detection of 2D Gray Image for Weld Defects
3D graphics shown in Fig. (4) are the conversions of 2D grayscale images, through the combination of histogram equalization and Otsu’s method of binaryzation followed by the construction of a morphological optimization algorithm. The flow diagram of weld defect extraction based on mathematical morphology is shown in Fig. (5).
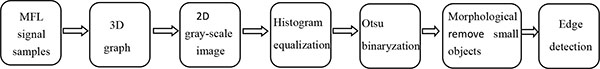 |
Fig. (5). Flow chart. |
According to this process, the specific steps are as follows:
- With the distance as the horizontal axis, the number of channels as the vertical axis, the gray value of each pixel as the amplitude of the leakage magnetic signal, turn the three-dimensional magnetic flux leakage signal into two-dimensional gray image. To extract graphical features accurately, and the gray value with grayscale linear transformation, the original gray value was mapped [0, 255] by standardization, the contrast enhancement effect of the weld image is achieved. After the transformation of grayscale patterns, the gray levels were 256, the white gray level was 255, and the black gray level was 0. Three kinds of grayscale conditions are shown in Figs. (6a and 7b).
As shown in Fig. (6) the contrast between the black line with the weld trough channel after grayscale linear transformation and the white line with the weld peak channel after grayscale linear transformation was clear. The edge detection is shown in the following step 5, with the result shown in Fig. (6b).
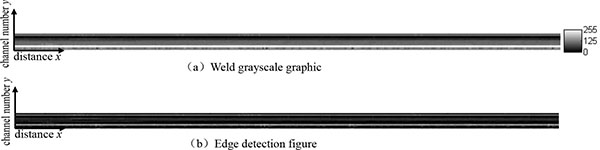 |
Fig. (6). Weld defect-free. |
Fig. (7a and b) shows the rectangular slot defects in different locations of the weld, with the increase in the rectangular depth of the defect. The differences between the peaks and troughs of the MFL signals increased along with the contrast between the white line with the peak of the rectangular slot defect after grayscale linear transformation. Moreover, the black line also expanded with the trough of the rectangular slot defect after grayscale linear transformation. Prefabricated rectangular slot defects were 2D space defects and belonged to the narrow seam shape defects. They appeared as white and black lines in the image, and the line along the direction of weld expanded which resulted in a contrasting image. From the resulting grayscale image, the information of the weld and the defect can be shown and compared with the MFL signals 3D figure graphics, which is more clearly illustrated by the grayscale graphics.
 |
Fig. (7). Grayscale of the rectangular slot defects in the weld. |
- Fig. (7a and b) was processed for histogram equalization, whose results are shown in Fig. (8a and b). The results showed that the overall contrast in the image improved, and the dynamic range of the pixel gray value expanded, which enhanced the overall contrast of the image.
- Binarization threshold was selected by using Otsu’s method for Fig. (7a and b) to process the image for binarization. The gray value which was less than the threshold value was set at 0, and the gray value bigger than the threshold value, was set as 255. The results are shown in Fig. (9a and b). The transform threshold, T, of the weld image after binarization was 136 and 137 as shown in Fig. (9a and b), respectively.
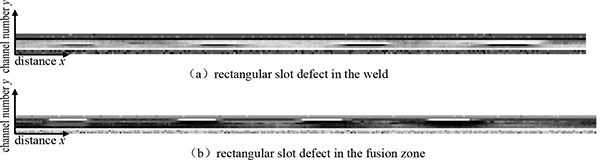 |
Fig. (8). Histogram equalization. |
After binarization processing the image may not separate the white line, the black line and background at the same time, rather only detects either the white line (peak) or the black line (trough). After binarization processing, the black line (trough) for the rectangular slot defect in the weld was separated from the background effectively along with the white line (peak) in the fusion zone. Fig. (7) shows the symmetric line for the peaks and the troughs, where the centre of the above edge of the black line is the centre of the rectangular slot defect, and the centre of the bottom edge of the white line is the centre of the rectangular slot defect.
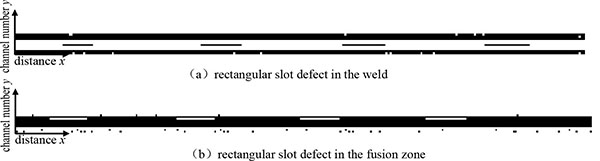 |
Fig. (9). Otsu method binaryzation. |
- To make the image clearer, mathematical morphology was used to remove small objects from Fig. (9a and b); the results are shown in Fig. (10a and b).
- By selecting the structure element type (4), through interactive tests, E1 operator-detection effect was best achieved by the dilation edge detection of Fig. (10a and b). The edge detection results are shown in Fig. (11a and b). From Fig. (11a) it can be observed that the defects were in the middle of the weld, and from Fig. (11b) shows that the defects were on the edge of the weld, which matched the rectangular slot defect in the weld and rectangular slot defect in the fusion zone.
The results showed that the outer edge extraction algorithm E1 can effectively detect edge characteristics of the weld and different weld locations with the rectangular slot defect, and the result of edge extraction realized the separation of the two.
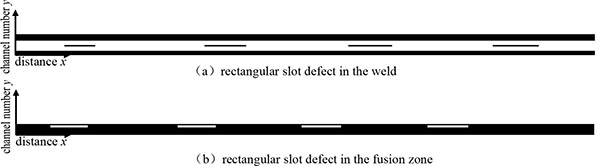 |
Fig. (10). Morphological remove small objects. |
The geometry and the position of the image showed that the edge detection of rectangular slot defects were narrow lines, and the locations of the line along the weld corresponded to the locations of the precast rectangular slot defects. The results were intuitive and reliable and showed good consistency. The edge detection figure can intuitively judge the distribution and location for rectangular slot defects in the weld, and the experimental results verified the feasibility and effectiveness of the presented method.
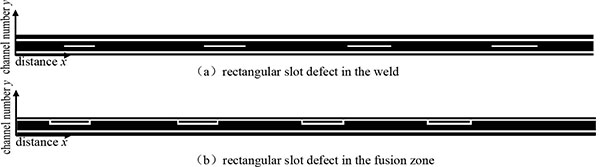 |
Fig. (11). Edge detection of E1 algorithm. |
4. LOCATE AND QUANTIFY DEFECTS
In order to accurately position and display grayscale outlines in from Fig. (11) the object coordinate system can be automatically set so that its direction and the aspect ratio match the image, as shown in from Fig. (12). The instrument had the length of 200 mm which is required for progressive scanning. From Fig. (3), the distance of the starting point for scanning 1 # defect was 60 mm, and the distance between the adjacent defects was 140 mm. The detect system shows that in the weld scanning graph of the weld experiment board the the value of pixel point corresponding with starting point is (xD, yD), the value of xD for detecting system of sampling points, multiplied by 2 is the travel distance (for the actual value is Distance, in order to do the comparison, herein the following Distance Value is used to measure, xD pixel values are multiplied by two in order to compare with the actual value), and the value of yD is determined by the channel number of the sensor, in which defect signals are.
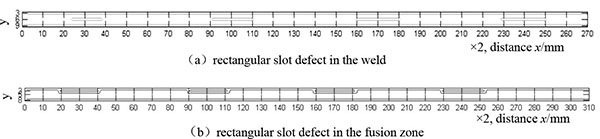 |
Fig. (12). Contour map. |
From Fig. (4) peaks and troughs of the defects were calculated by two adjacent channels, and the position of the defect with the corresponding channel number matched the distribution of the defects as shown in from Fig. (3). The distance of the adjacent sensors was 1 mm, consistent with 1 mm width of the rectangular slot defect. Location information, dimension information and corresponding error in the experiment are shown in Table 1.
| Project | 1# | 2# | 3# | 4# | 5# | 6# | 7# | 8# | |
|---|---|---|---|---|---|---|---|---|---|
| Distance and error /centroid coordinate xD | Actual distance /mm | 60 | 200 | 340 | 480 | 60 | 200 | 340 | 480 |
| Image displaying distance /mm | 2×31 | 2×100.5 | 2×170 | 2×239.5 | 2×30 | 2×101 | 2×170.5 | 2×241 | |
| Relative to the actual distance /mm | 60 | 60 | 60 | 60 | 60 | 60 | 60 | 60 | |
| Relative positioning error /% | 3.33 | 1.67 | 0 | 1.67 | 0 | 3.33 | 1.67 | 3.33 | |
| Length and error | Actual length /mm | 40 | 40 | 40 | 40 | 40 | 40 | 40 | 40 |
| Image displaying length /mm | 2×15 | 2×19 | 2×20 | 2×21 | 2×20 | 2×20 | 2×21 | 2×22 | |
| Relative error /% | 25 | 5 | 0 | 5 | 0 | 0 | 5 | 10 | |
| Gray value and gray difference | Average gray value of the defect | 106.13 | 94 | 52.52 | 22.36 | 142.33 | 157.43 | 222.86 | 231.30 |
| Average gray value of the weld | 107.84 | 107.84 | 107.84 | 107.84 | 107.84 | 107.84 | 107.84 | 107.84 | |
| Gray difference | -1.71 | -13.84 | -55.32 | -85.48 | 34.49 | 49.59 | 115.02 | 123.46 |
The errors are calculated using the following formula:
 |
(5) |
As shown in Table 1, the location mean difference was 1.875%, the maximum error was3.33%, and the minimum accuracy was 96.67%. The average error of the measuring length was 6.25%, the maximum error of the measuring length was 25%, and the minimum error of the measuring length was 75%.
Studying the change of MFL image characteristics of the rectangular slot by the geometry dimension of the single defect depth direction (the dimension in other direction is unchangeable), the black degree distribution of defects corresponds with the depth. In order to describe the blackness distribution of defect, gray difference is defined, first, a subset of grayscale image is selected in the original homogeneous area of the weld to calculate the average gray level
 . Following this, from the defects’ coordinates shown in from Fig. (12). From Fig. (7) is used to calculate the average gray level
 of the defects.
The gray level difference between the weld and the defect can be calculated as:
 |
(6) |
From 1#-8# defect gray level differences are shown in Table 1, with the increase in the depth of the defect and in the grayscale difference ∆h of the rectangular slot defect in the weld of different regional distributions. Meanwhile, when the rectangular slot defects were in the weld, the test results showed a black line (troughs), and the ∆h symbol became negative. When the rectangular slot defects were in the fusion zone, the test result showed a white line (peaks), and the symbol became positive. The positive and negative symbol can be considered as the parameters of the defect location.
CONCLUSION
- According to the structural characteristics of the tank bottom plate weld, a new type of continuous non-contact scanning MFL system for the weld has been developed in which the magnetization direction is vertical to the travelling direction of the detection system. By using a new magnetic system, continuous non-contact MFL scanning for the rectangular slot defect in different areas of weld (in the weld and in the fusion zone), and the information of 3D leakage magnetic field were obtained.
- This paper introduced a detection principle different from the traditional MFL detection principles, based on 3D signals and signal processing methods, which is based on 3D leakage magnetic curve graphics and converts the 3D MFL signals into 2D grayscale images. By constructing a mathematical morphology optimization algorithm, the edges of the weld shape contour and the rectangular slot defect in different areas of the weld (in the weld and in the fusion zone) were extracted. The edges were clear, and had good edge graphics features.
- From the in-depth analysis of three aspects of the defects including’ geometry, location, and black degree distribution, the figural shape detecting in the rectangle slot defect edge is showed as narrow lines, and the location of the line along the weld corresponded to the location of the precast rectangular slot defects with the positioning accuracy of 96.67%. Gray difference ∆h between the rectangular slot defects in different areas of the weld (in the weld and in the fusion zone) increased with the increase in the defect depth. This method can directly indicate the defect shape, location and other information, the visual display of the MFL testing of the weld defects was also realized, which provided a new train of thought for the non-destructive testing and recognition of the weld defects.
CONFLICT OF INTEREST
The authors confirm that this article content has no conflict of interest.
ACKNOWLEDGEMENTS
This work was sponsored from the project fund: National Natural Science Foundation of China (Project Number: 51607035, 11272084, 11472076) and Petro China Innovation Foundation (Project Number: 2015D-5006-0602) and Heilongjiang Postdoctoral Foundation(Project Number: LBH-Z16040).