
RESEARCH ARTICLE
Evaluation of the Percolation Sensitivity of Loose Sandstone Using Digital Core Technology
Jin Pang1, Junnan Li1, *, Jie Liang1, XiaoLu Wang2, Mingqing Kui2
Article Information

Identifiers and Pagination:
Year: 2018Volume: 11
First Page: 84
Last Page: 97
Publisher Id: TOPEJ-11-84
DOI: 10.2174/1874834101811010084
Article History:
Received Date: 09/4/2018Revision Received Date: 26/4/2018
Acceptance Date: 15/5/2018
Electronic publication date: 22/06/2018
Collection year: 2018
open-access license: This is an open access article distributed under the terms of the Creative Commons Attribution 4.0 International Public License (CC-BY 4.0), a copy of which is available at: https://creativecommons.org/licenses/by/4.0/legalcode. This license permits unrestricted use, distribution, and reproduction in any medium, provided the original author and source are credited.
Abstract
Background:
The integrity of the extracted core in loose sandstone gas reservoirs is poor, and because hydration and collapse easily occur, it is difficult to evaluate the sensitivity characteristics accurately by the traditional core flooding experiments.
Objectives:
We instead investigate the stress sensitivity and water sensitivity of the formation water soaking time using digital core technology.
Methods:
We take the core of a loose sandstone gas reservoir as a research object and begin by scanning the core samples with a CT scanner. A three-dimensional image of the core can be obtained, the digital information extracted, the pore structure of the porous media mapped directly to the network, and a digital core established using the principles of fractal geometry. The three-dimensional pore network model can also be extracted. Next, we can compare and correct the results calculated by the model based on the real core experimental results, and an objective and effective digital core model can be obtained.
Results and Conclusion:
Finally, we can calculate the different effective stress, pore throat parameters (pore throat radius, shape factor, coordination number, pore-throat ratio) and relative permeability of different formation water injury times. The research results demonstrate that in sandstone gas reservoir development, as the effective stress continuously increases, the rock pore-throat parameters continue to decrease, and the permeability of the reservoir rock ultimately declines by more than 43.2%. Clay minerals will expand after the edge and bottom water intrude into the reservoir and soak it for a long time: the pore throat is significantly narrowed within 30 days, while after 30 days more, the pore throat undergoes any only slight further changes, and the final permeability decline of the reservoir rock is up to 5.7%. The research results provide important basic petrophysical data for the development of loose sandstone gas reservoirs which, in turn, provide a scientific basis for formulating a reasonable gas production rate in a gas reservoir.
1. BACKGROUND
Traditional rock sensitivity research primarily depends on indoor flooding experiments, such as velocity sensitivity, salt sensitivity, acid sensitivity, alkali sensitivity, and stress sensitivity. In some special cases, however, the limitations of sampling and experimental conditions make the experimental process and results impossible to achieve. In recent years, with the development of computer science and high-resolution image processing technology [1-3], digital core technology has been gradually introduced into physical reservoir research, resulting in a new research method [4, 5] Using a real rock pore space reaction 3D digital core based on a rock microstructure reconstruction [6-8], the research scope involves microscopic percolation mechanisms, core displacement simulation experiments, prediction of core macroscopic conductivity, evaluation of oil displacement effects, production dynamic simulation of reservoirs and determining the boundaries of oil and gas field development technology policies [9]. Compared with the traditional physical rock experiments, digital core samples are readily available, high-speed, and low-cost, and they make it possible to quantitatively evaluate rock properties and calculate physical quantities that are difficult for conventional physical experiments to measure [10]. Currently, the digital core has been widely used for carbonate reservoirs, shale gas, and tight oil and gas reservoirs [11-15] with good results.
A loose sandstone gas reservoir is characterized by loose, easily hydrated rock [16]. It is difficult to core in the process of drilling, and the rock stress sensitivity is obvious. A small amount of samples cannot reflect the real situation underground, with the high clay content, fine particle size, easily slurried core samples, and sand production in the process of displacement. Therefore, as conventional displacement experiments are difficult to achieve, it is difficult to evaluate the sensitivity of the rock under coring conditions accurately, which increases the difficulty of developing gas reservoir development technology policy [17]. As the digital core technology has been successfully applied in all types of complex hydrocarbon reservoirs, it will be introduced for loose sandstone gas reservoir physical analysis in this study, to examine the sensitivity of rock through establishing a digital core of loose sandstone.
It’s difficult to construct a loose sand sample, and the sample will be destructed during the experiment process, which makes the sample sensitivity test cannot be finished. However, the digital core can figure out all the problems during the sensitivity test. At the same time, evaluating the percolation sensitivity of loose sandstone using digital core technology will support the reasonable production pressure controlling and water invasion researching.
2. METHODS
2.1. Setup of Digital Core
The core sample derived from SeBei no.2 gas reservoir in qaidam basin in Qinghai province of China, which belongs to the quaternary system of the Pleistocene series and its depth is from 1320.16m to 1327.24m
Depending on the X-ray diffraction analysis, argillaceous and Silty mudstone consist the core sample, which average contains 48.7% argillaceous and 32.9% Silty mudstone. And most of consisting rock particles are so small that below the silt level. The absolute content of clay is from 31.1% to 92% in the mudstone, and that is from 13.5% to 31.1% in the sandstone. Clay minerals contained illite 36.7%, chlorite 10.31%, illite and smectite formation 2.48%. The illite and smectite formation will damage the reservoir layer when it water-swellable. In addition, the smaller pore-throat channels will be plugged that the kaolinite, illite and chlorite have dispersed and migrated when they were water-swellable.
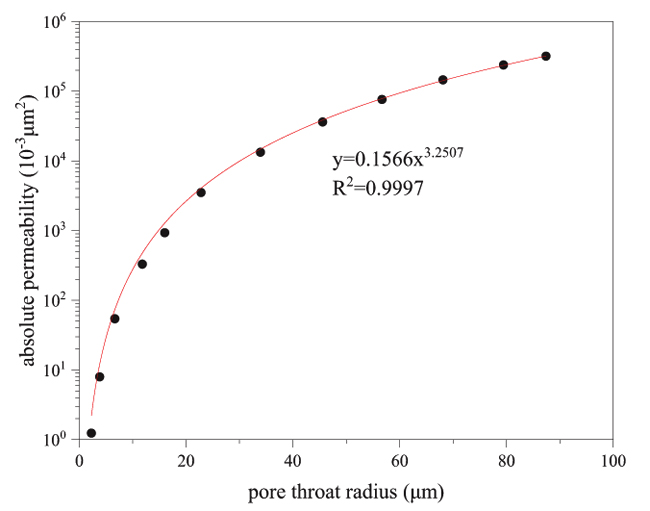 |
Fig. (1). pore throat radius and the absolute permeability relation curve. |
First, we scan the core sample by using the CT scanner. Thus, a three-dimensional image of the core can be obtained, the digital information can be extracted, the pore structure of porous media is mapped directly to the network, and a digital core is established using the principles of fractal geometry. The three-dimensional pore network model can also be extracted and is then used to calculate the percolation parameters in different stress states and under different water cut conditions, focusing on permeability, relative permeability and capillary pressure. The process of constructing the digital core model is shown in Fig. (1).
2.2. Core Scanning
The CT scanner is used to scan the whole diameter core. The length of this rock sample is 14.5 cm, and the coring well section is 1320.16~1327.24 m. The core is loose, the clay content is 42.04% based on the logging interpretation results, the porosity is 28.42%, the permeability is 9.87×10⁻³ μm2, the gas saturation is 45.20%, and the irreducible water saturation is 54.53%. The coring sample is as shown in Fig. (2).
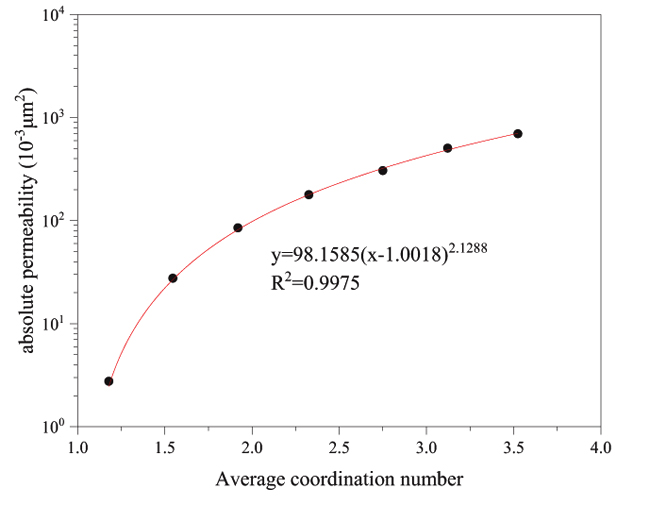 |
Fig. (2). Average coordination number and absolute permeability relation curve. |
2.3. Image Digitization
Using Micro XCT scanner to scan and construct the digital core. The process includes rock sample scanning, image reconstruction, filtering processing and image segmentation. According to the output image results of CT scanning, a 1.5 cm×1.5 cm image area is chosen as the image analysis element, and the pixels of the image are converted, setting up an isosurface, forming a real three-dimensional digital core after lamination. The process is shown in Fig. (3).
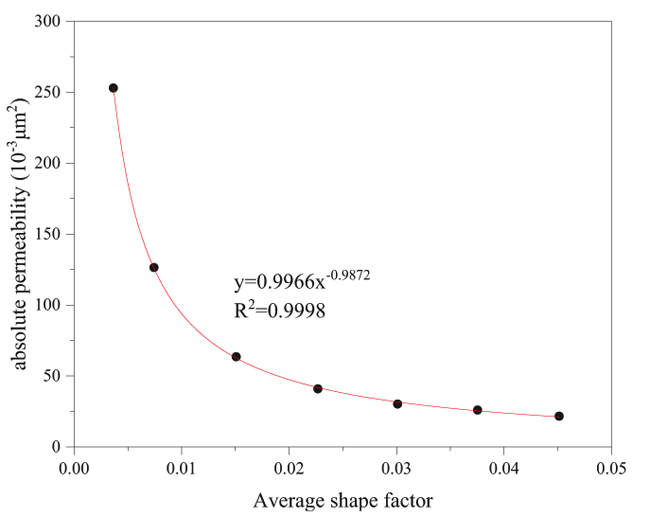 |
Fig. (3). Average shape factor and absolute permeability relation curve. |
2.4. Porosity Modelling
The topological structure of pore space has been characterized by Maximum ball algorithm. Firstly, it was searched for the biggest ball and filled in the pore space center. Secondly, defining the biggest ball as a pore, the others ball are pore-throat channels, then take network-grid to connect pore space and accurately depicted. Thirdly, counting the characteristic parameters of every grid, such as radius, volume and shape factors and so on. At last, construct the pore grid model by network-grid extraction algorithm as a foundation platform for multiphase flow research.
The basic parameters of the pore network can be extracted from digital core, including the network model size, pore-throat ratio, distribution of pore throat radius, coordination number, shape factor, and so on, as shown in Table 1, in addition to establishing the pore network model and calculating the gas-water relative permeability curves and capillary pressure curves.
| Parameter Name | Values |
|---|---|
| Network Model Size | 1.5 mm×1.5 mm×1 mm |
| Pore-throat Radius | 0.053~160 μm |
| Average Pore-throat Ratio | 2.37 |
| Average Coordination Number | 2.85 |
| Initial Porosity | 30.2% |
| Initial Permeability | 29.6×10⁻³ μm2 |
| Clay Content | 33.2% |
| Gas-water Interfacial Tension | 76.8 mN/m |
| Average Shape Factor | 0.0557 |
| Moisture Equilibrium Contact Angle | 45º~50º |
| Formation Water Density | 1.06 g/cm3 |
| Gas Density | 0.069 g/cm3 |
| Formation Water Viscosity | 1.03 mPa.s |
| Gas Viscosity | 0.019 mPa.s |
3. PERMEABILITY MODEL
The absolute permeability of Loose Sandstone is impacted by pore throat radius, coordination number and pore shape factor influence. So we choose these parameters as permeability model main parameters.
It concludes the exponential curve and data model through curve fitting from Figs. (4 & 6).
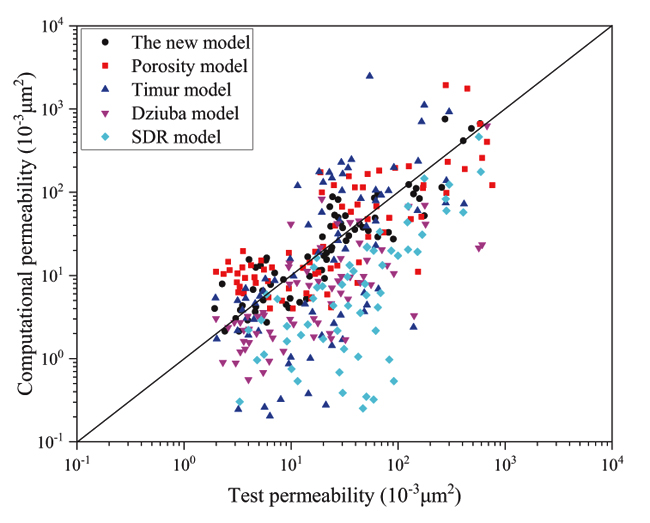 |
Fig. (4). Calculation permeability and test permeability of different models. |
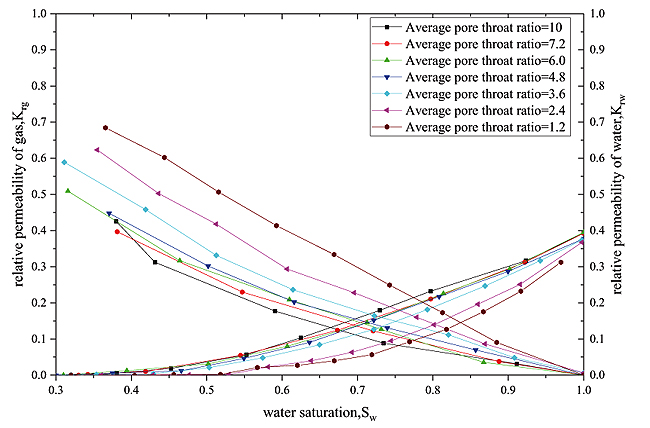 |
Fig. (5). Relative permeability curve in different pore throat ratio. |
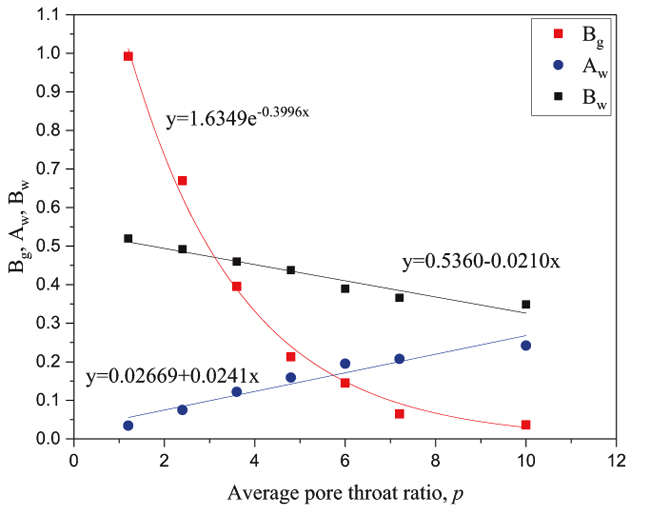 |
Fig. (6). The relationship curve between different average pore throat ratio and fitting coefficient. |
Based on the analysis of the influence of pore structure parameters on absolute permeability, the absolute permeability calculation model is constructed:
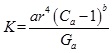 |
(1) |
Where: Ca is Average coordination number (dimensionless); r is throat radius,(μm); Ga is pore throat shape factor, (dimensionless); a is Constant coefficient, which decided on the core(μm-2); b is absolute permeability index, (dimensionless).
According to the fitting, the relation of Ca and Swi can be explained on the following:
 |
(2) |
The average pore throat shape factor Ga and the formation factor F follow the linear relationship, and the specific form is.
 |
(3) |
Where: Fitting coefficient α depending on the permeability of reservoir. Respectively, α is 6×10⁻⁵ when K <10×10-3μm2;α is 0.0004 when 10×10-3μm2<K<100×10-3μm2;α is 0.0024 when K>100×10-3μm2,
r is the most important data in the form 1 which can be obtained by form 4
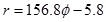 |
(4) |
The parameter a and be can be obtained through the model data fitting. Specifically, a is 8.96×10⁻⁵ and b is -1.998.
Comparing to Timur model, Dziuba model and SDR model, the calculation results of our permeability model is more accurate, which shows in Fig. (7).
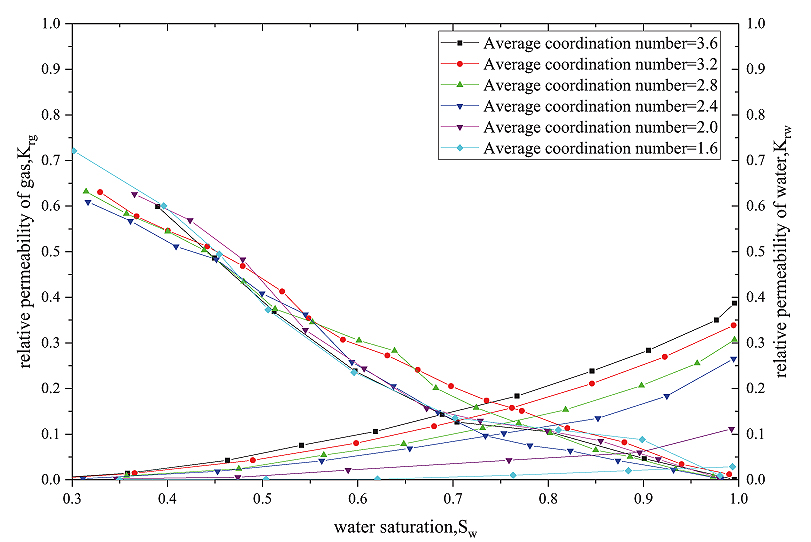 |
Fig. (7). The phase permeability curve of different average coordination Numbers. |
4. Relative Permeability Model
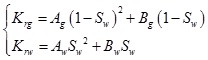
The relationship between Gas phase relative permeability krg and Water saturation sw in different pore throat ratio of SeiBei loose sandstone can be transformed with the binomial relation. (Fig. 7)
 |
(5) |
Where: Ag and Bg are Coefficient of the gas phase.
The relationship between Gas phase relative permeability krw and Water saturation Sw in different porosity ratio of SeiBei loose sandstone can be transformed with the binomial relation (Fig. 5).
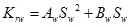 |
(6) |
Where: Aw and Bw are Coefficient of the water phase
Because the gas saturation lower than 1, and Ag is the coefficient of quadratic function squared, Bg is the coefficient of the quadratic function. So the influence of Bg on gas phase relative permeability is greater than Ag. The relationship between the gas phase coefficient Bg and the pore throat ratio (p) satisfies the exponential function, which shows in Fig. (6).
The relation between Krg and Sw of SeiBei loose sandstone is satisfied with a quadratic function, and this regular function is also satisfied between Krw and Sw. it shows in Fig. (7).
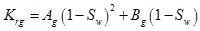
The relationship between the gas phase coefficient Bg and the average coordination number (Ca) satisfies the linear function relation, and the water phase coefficient Aw, Bw and the average coordination number can satisfy the quadratic function relationship, as shown in Fig. (8)
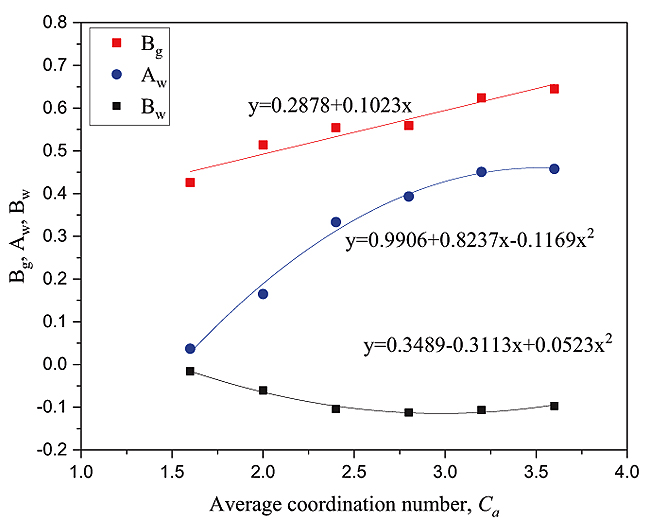 |
Fig. (8). The relationship between different average coordination Numbers and fitting coefficients. |
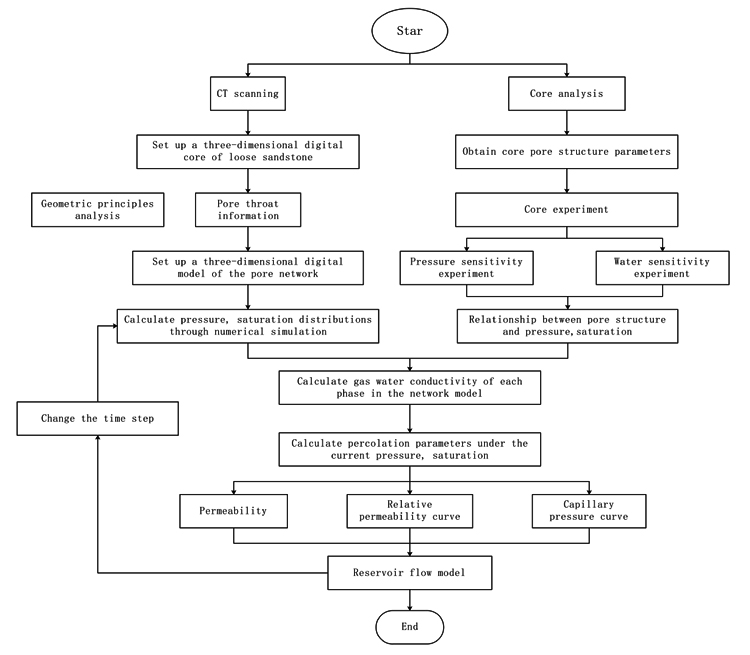 |
Fig. (9). Establishment of the digital core model. |
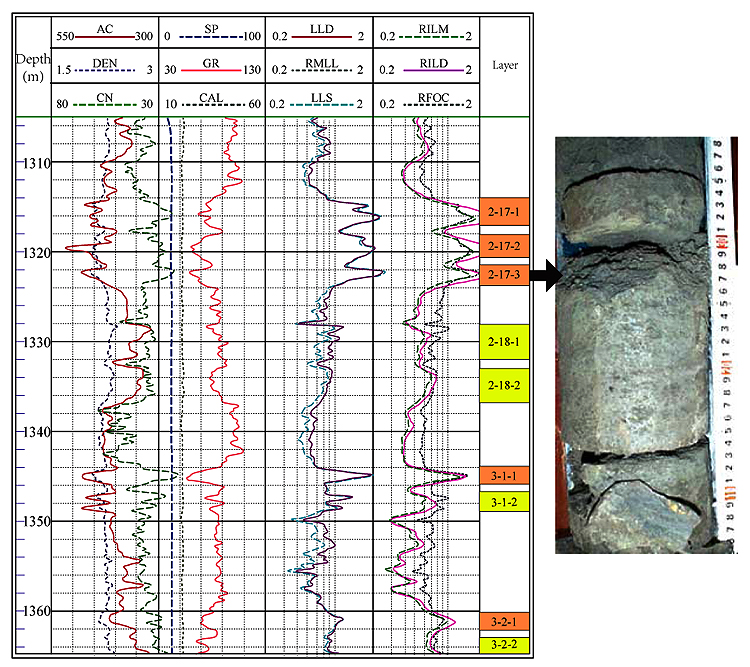 |
Fig. (10). Core samples. |
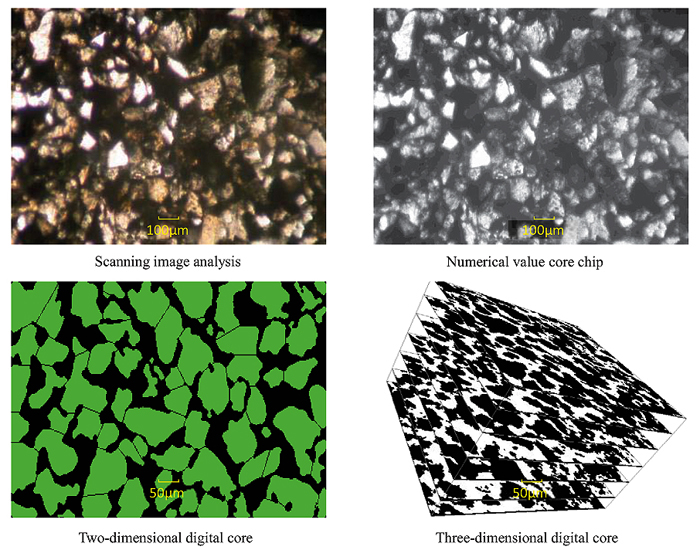 |
Fig. (11). 3D digital core processing. |
Based on the previous analysis, it constructs the following Relative permeability model
 |
(7) |
Gas phase coefficient Bg and water phase coefficient Aw and Bw can be expressed as linear combination forms of each parameter:
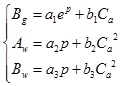 |
(8) |
5. CORE MODEL CALIBRATION
After the digital core model is established (Figs. 9-11), it must be further corrected and tested to determine whether it can objectively reflect the true percolation characteristics of the reservoir rock. Accordingly, we compare it a small amount of displacement experiment data with the calculated digital core results.
From the experimental results on the permeability of core displacement under different effective stress conditions (Fig. 12), when the effective stress increases from 4.16 MPa to 10.84 MPa, the permeability decreases by 43.1%, and when the effective stress increases from 10.84 MPa to 24.10 MPa, the permeability decreases by 66.7%%. The permeability of the digital core decreases by 42.9% and 64.7%, respectively, for these two pressure changes, showing very similar results. Based on comparing the permeability changes under different clay content conditions, the error between the digital core and the real core is controlled within 10% (Fig. 13), which is small.
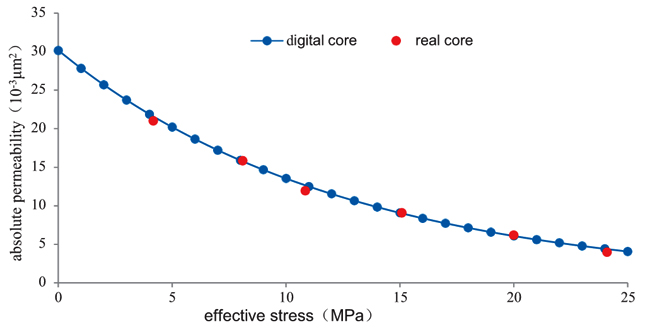 |
Fig. (12). Comparison of real core and digital core stress sensitivity. |
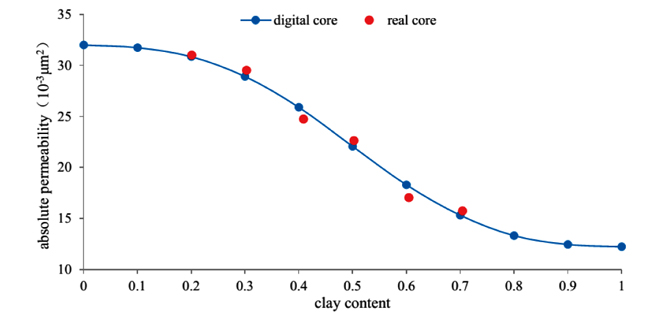 |
Fig. (13). Comparison of permeability influenced by clay content between the real core and digital core. |
The parameters of the digital core, such as the clay content, pore-throat radius, pore-throat ratio, shape factor, coordination number and other parameters, are adjusted, and the gas phase relative permeability Krg and water phase relative permeability Krw are calculated under different water saturation (Sw) conditions, followed by matching the relative permeability of the real core and of digital core to make them basically the same (Fig. 14). Thus far, the percolation characteristics of the established digital core and the real core have been basically consistent, indicating that the established loose sandstone digital core is of great reliability and can be used to study the sensitivity of loose sandstone.
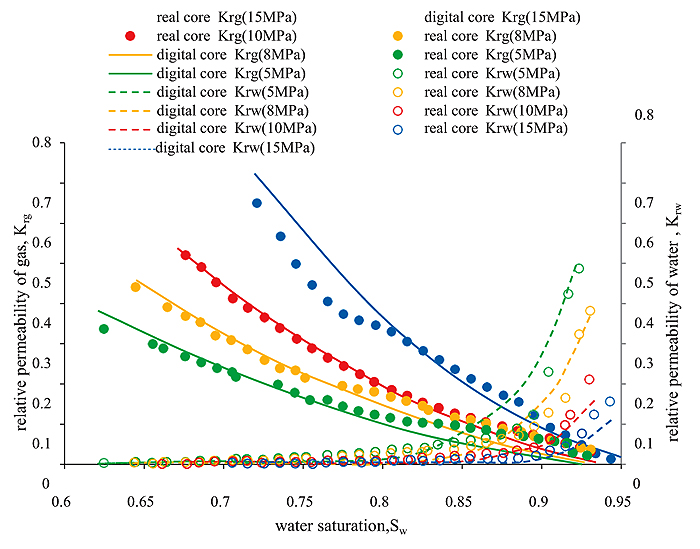 |
Fig. (14). Comparison of real core and digital core relative permeability curves. |
6. RESULTS
6.1. Stress Sensitivity Evaluation
Due to the stress sensitivity of loose sandstone reservoirs, the porosity and permeability decrease in response to formation pressure changes, which influence the percolation rule and characteristics of the fluid flow and lead to changes in the shape of the relative permeability curve [18].
In evaluating the stress sensitivity of loose sandstone using the digital core, in addition to the network model input parameters for the initial value, we must also input the initial porosity and permeability of the core, the proportion of different interface shape factors, the triangle interface inside the half angle value, the stress sensitivity index and other parameters.
First, the changes in input parameters and effective stress need to be determined. The dynamic stress sensitivity model is used to calculate the porosity and permeability of the reservoir after the pressure change.
Then, using the porosity and permeability, combined with the characteristic parameters of the dynamic model, we calculate the characteristic parameters after pressure changes: The average pore-throat radius, average shape factor, average coordination number and the average pore-throat ratio (shown in Table 2). Finally, the pore network model program is used to calculate the relative permeability curve after pressure changes (Fig. 15).
| Effective stress changes ΔP (MPa) | Average pore throat radius (μm) | Average shape factor (Dimensionless) | Average pore throat ratio (Dimensionless) | Average coordination number (Dimensionless) |
|---|---|---|---|---|
| 2 | 0.88 | 0.058 | 2.54 | 3.06 |
| 5 | 0.83 | 0.054 | 2.50 | 2.93 |
| 8 | 0.80 | 0.050 | 2.46 | 2.81 |
| 10 | 0.74 | 0.044 | 2.39 | 2.60 |
| 15 | 0.64 | 0.033 | 2.28 | 2.24 |
| 20 | 0.50 | 0.016 | 2.13 | 1.79 |
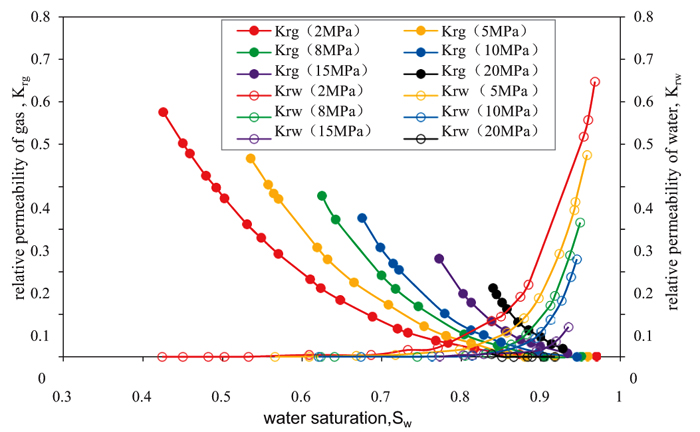 |
Fig. (15). Influence of effective stress on relative permeability. |
The results show that, as the effective stress increases from 2 MPa to 20 MPa, the rock is compressed constantly, the pore-throat is narrowed, the capillary pressure becomes large, the two-phase percolation region is narrowed, and the relative flowability of the non-wetting phase increases by more than 43.2%; in contrast, the relative flowability of the wetting phase decreases by more than 43.2%. Accordingly, in the process of real-life gas reservoir development, as the reservoir pressure drops, the effective stress will increase, and the gas production will drop significantly due to rock compression. Therefore, we should slow down to achieve a balanced exploitation mode in the process of decompression.
6.2. Sensitivity Assessment of Formation Water Damage
After water invasion of the loose sandstone gas reservoir, the water and water-sensitive clay minerals and sand are in contact for a long time, causing the clay minerals to swell, fall off and migrate, reducing the permeability of the rock [19].The length of time the formation undergoes soaking will affect the degree of damage to the rock permeability.
In evaluating the formation water damage using the digital core, in addition to the network model input parameters for the initial value, we must also input the initial porosity and permeability of the core, the proportion of different interface shape factors, the triangle interface inside half angle value, the clay content, the different water soaking times, the plastic index and so on.
First, the input parameters and different water soaking times are determined, and the clay content is used to calculate the clay expansion coefficient, combined with the dynamic expansion of the clay model, The reservoir porosity and permeability are calculated for the same clay content and different water soaking times. Then, using the porosity and permeability, combined with the characteristic parameters of the dynamic model, the following characteristic parameters are calculated after pressure changes: the average pore-throat radius, average shape factor, average coordination number and the average pore-throat ratio (Table 3). Finally, the pore network model program is used to calculate the relative permeability curve after pressure changes (Fig. 16).
|
Contact time (days) |
The average port throat radius (µm) |
The average shape factor (Dimensionless) |
The average pore throat ratio (Dimensionless) |
The average coordination number (Dimensionless) |
|---|---|---|---|---|
| 10 | 0.88 | 0.045 | 2.36 | 2.51 |
| 30 | 0.85 | 0.041 | 2.32 | 2.37 |
| 100 | 0.83 | 0.040 | 2.30 | 2.32 |
| 300 | 0.83 | 0.040 | 2.30 | 2.32 |
| 600 | 0.83 | 0.040 | 2.30 | 2.32 |
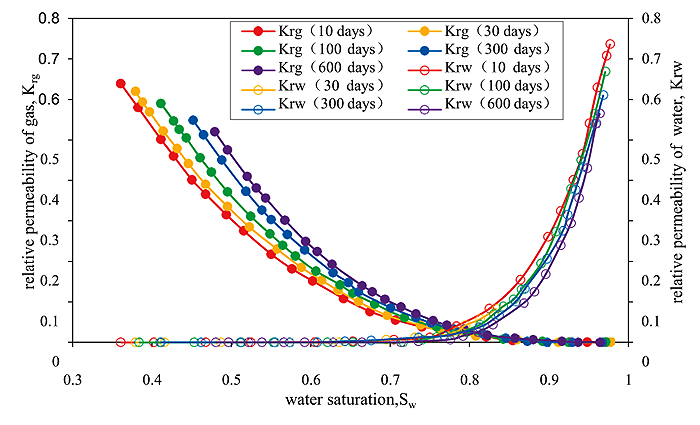 |
Fig. (16). Effects of water contact time with the formation of relative permeability. |
The results show that as the water immersion time of the rocks varies from 10 days to 30 days, the clay gradually expands in the sandstone, the pore-throats are narrowed, the capillary pressure becomes large, the two-phase percolation region is narrowed, and the relative flowability of the non-wetting phase increases by more than 5.7%, whereas the relative flowability of the wetting phase decreases by more than 5.7%. When the core is in prolonged contact with water, up to 300 days, the change in the pore structure parameters is very small. This result indicates that the gas well production capacity in the SeBei field would decline significantly after the invasion and soaking with water, and therefore we must take effective waterproofing, water control and flood control measures in the process of development.
CONCLUSION
- Using CT scanning and digital image processing technology, a digital core model of loose sandstone in the SeBei gas reservoir is established. After correction of the digital core model, comparison with the experimental data shows that the error is controlled by 10%, the digital core model is highly reliable. We can thus overcome the restrictions of hard coring and experimental conditions in loose sandstone gas reservoirs.
- The stress sensitivity studies performed using the digital core of loose sandstone in SeBei indicate strong stress sensitivity characteristics in the SeBei loose sandstone gas reservoir. As the effective stress increases, the rock is obviously compressed, and the reservoir rock permeability decreases by 43.2%. Therefore, we should slow down to achieve a balanced exploitation mode in the process of decompression.
- Digital core research on the formation water damage of loose sandstone in SeBei indicates strong water sensitivity characteristics in SeBei loose sandstone gas reservoir. After soaking with water for 30 days, the reservoir rock permeability decreases by more than 5.7%. we should avoid water invasion of the reservoir and extended soaking as much as possible in the development process.
- The loose sandstone is fragile rock and it is easily decomposed by water. Digital core technology can evaluate the real core stress sensitivity and water sensitivity, which work out the problem that it is hard to finish the conventional core sensitivity experiment research. And it saves much cost of the experiment.
- Comparing of the stress sensitive experimental results, the digital core precision rate is above 98%, which means the digital core simulated exactly. It provides scientific exploitation basis for loose sandstone reservoir development.
CONSENT FOR PUBLICATION
Not applicable.
CONFLICT OF INTEREST
The authors declare no conflict of interest, financial or otherwise.
ACKNOWLEDGEMENTS
This project was funded by Chongqing Universities of Science and technology Team Plan (201027) and Science and Technology Innovation foundation of Chongqing (CSTC- 2016-JCYJ-A0360)