RESEARCH ARTICLE
Early Inspection of Weld Seams on Gas Pipelines Based on Metal Magnetic Memory Method
Kexi Liao, Lijia Long*, Huaixin Zhang
Article Information
Identifiers and Pagination:
Year: 2016Volume: 9
First Page: 1
Last Page: 9
Publisher Id: TOPEJ-9-1
DOI: 10.2174/1874834101609010001
Article History:
Received Date: 20/9/2014Revision Received Date: 11/04/2015
Acceptance Date: 30/07/2015
Electronic publication date: 09/02/2016
Collection year: 2016
open-access license: This is an open access article licensed under the terms of the Creative Commons Attribution-Non-Commercial 4.0 International Public License (CC BY-NC 4.0) (https://creativecommons.org/licenses/by-nc/4.0/legalcode), which permits unrestricted, non-commercial use, distribution and reproduction in any medium, provided the work is properly cited.
Abstract
In order to investigate the magnetic abnormality influenced by stress in weld seams, experiments on three types of weld seams were carried out and a stress concentration detection instrument - metal magnetic memory (MMM) tester was used. MMM tests on gas pipelines in Puguang initial station in China were conducted and compared MMM wave diagram and mathematical analysis of MMM data and the quantitative MMM characteristics of T weld, straight weld and girth weld. The experiment results showed that different weld seams have different MMM characteristics, types of defects can be identified based on magnetic anomaly signal waveform characteristics and quantitative MMM features which evaluate the pipeline defects quantitatively.
1. Introduction
Pipeline quality detection plays an important role in the process of oil and gas pipeline construction. Nondestructive detection techniques (NTD) are generally used to detect defects in pipelines. Though conventional NDT methods, including ray detection, ultrasonic testing, magnetic particle testing, eddy current testing and so on, are in a mature stage of development, some problems remain. NTD methods are insufficient to ensure reliable evaluation of weld quality because these methods only aim at detecting non-compactness weld defects without testing residual stress [1-3]. And, in practice so far, conventional testing methods fail to detect internal imperfections on fillet weld, T weld, the thin weld (less than 6 mm), the contacted weld and triangle tube weld. Traditional NDT methods are also not suitable for detecting early defects. In this circumstance, the metal magnetic memory method (MMM) is the only feasible nondestructive testing method to solve these problems [4-6].
All the ferromagnetic materials are influenced by the earth’s magnetic field. Due to the magneto-mechanical effect, magnetic field leakage will be produced in the stress concentration zone from the earth’s magnetic field and mechanical load. With increasing stress, the magnetic field intensity increases; but when the stress is removed, the magnetic state is still retained. The associated magnetic domain boundary will grow and change its direction and will develop magnetism on the surface that can be tested by using this specific magnetic device [7, 8].
Fig. (1) is a diagram of magneto-elastic effects caused by residual magnetism growth. From the figure we can see that, when a part of the structure faced the external magnetic field and was subjected to cyclical loads, the residual magnetism of the parts of structure increased with the growth of magnetic induction ∆B. After the removal of the load, the reversible residual magnetic component decreases, while the irreversible components are retained. The phenomenon that the magnetization M is changed with the variation of stress or strain is called magneto-mechanical effect [9].
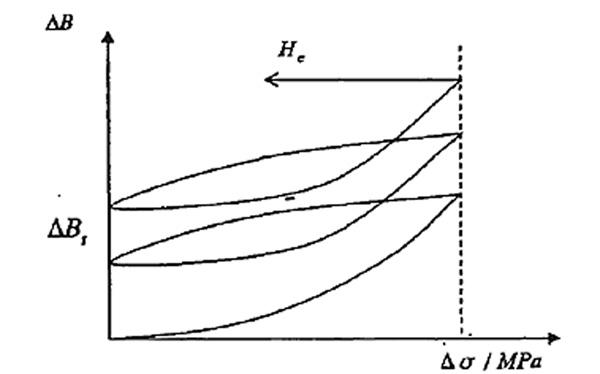 |
Fig. (1). Magneto-mechanical effect. |
Metal magnetic memory tester is a new nondestructive detection technique based on recording and analyzing the distribution of the self-magnetic leakage field that is produced by its stress concentration zone, without demagnetizing the detecting objects or inducing special magnetization [10, 11]. It works by testing the natural magnetism formed in the processes of manufacturing and utilization. In addition, it can find early defect that also gives information about the actual state of stress and deformation to find out the reasons why the damage developed [12, 13]. The fundamental difference of this technique from traditional ones is the MMM technique, measures the earth magnetic field initiated in the process of manufacturing and utilization, instead of an external magnetic field applied an stimulus source [13, 14]. Therefore, MMM shows its unique advantages over the field of nondestructive testing.
The ferromagnetic component will produce a magnetic memory effect when faced with stress and the external magnetic field. Despite that the strength of the Earth's magnetic field is weak, the magnetization of the magnet will not directly create large practical value, but the Earth's magnetic field can play a role in the bias magnetic field. By changing the pressure of the magnetic bias field magnet, the constant of magnetostrictive stress will not be zero, resulting in a net magnetic field under the effect of stress.
Effective field [9] (Formula 1) is generated when ferromagnetic materials are subjected to stress under the effect of the geomagnetic field:
 |
(1) |
Hp- Net magnetic field under the effect of stress. A/m
He- External magnetic field, A/m
Ms-Saturation magnetization vector, A/m
a- Ferromagnetic material coefficient, H/m.
b- Magnetization and strain correlation coefficient, H·A/m2
σ-Stress, MPa
µo-Vacuum magnetic permeability, H/m.
Formula (2) can be obtained by partial derivative of stress σ on both sides of the equation:
 |
(2) |
For ferromagnetic material (a > 0) with magnetostrictive coefficient λ > 0, Hp is a monotonically increasing function of σ, so when value σ is largest we can get the maximum Hp
 |
(3) |
Because λ > 0, the direction of magnetization of the material under tensile stress (σ > 0) is along the direction of pull action force, only existing an axial component of magnetization of the material without a radial component. Therefore, in a position of maximum stress σ, tangential component of the leakage magnetic field outside the sample must appear a maximum value while the normal component is zero (Fig. 2).
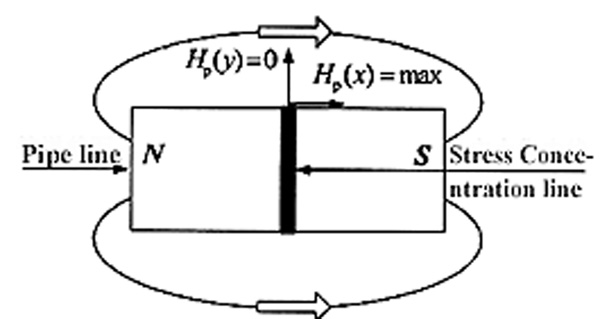 |
Fig. (2). Magnetic memory testing schematics. |
Up to now, MMM technology has been studied by many scholars. Li Haiguang introduced the application of weld inspection to pressurise vessel and discussed the reliability, integrity and other aspects of detection [15]. Dai Guang found the weld defects by applying leakage magnetic gradient [16] Liu Hongguang analyzed the application feasibility of magnetic memory testing technology in weld detection [17]. Yuan Qi, through practical application for rapid detection of stress-strain state found the metal magnetic memory method superior to others, and also gave the typical cases of application [18]. The basic principles to justify the possible defect location by using MMM tests are according to the two criteria’s where the tangential component of magnetic flux leakage, Hp(y) perpendicularly oriented to the surface changes to its polarity and its gradient dH/dX reaches a peak value [19-21].
For investigating the magnetic abnormality influenced by stress in weld seams, experiments on three types of weld seams were performed and the metal magnetic memory (MMM) signals were recorded. Due to the problem that existing MMM testing cannot directly determine the type of pipeline defects in detail and the test results are strongly dependent on the personnel experience, this paper processes the MMM testing data of three welding seams aiming at providing a quantitative analysis of MMM characteristics based on pipelines in Puguang initial station in China, which will contribute to determine the definite types of pipeline defects associated with metal defects and mechanical stresses.
Chemical composition (wt %) of the pipeline.
| Steel | C (carbon) | Mn (Manganese) | P (Phosphorus) | S (Sulfur) | Ni (Nickel) | Cr (Chromium) |
|---|---|---|---|---|---|---|
| WPHY-65 | ≤0.2 | 1.00-1.45 | ≤0.03 | ≤0.01 | ≤0.5 | ≤0.3 |
2. Experiment
The experiment was carried out in Puguang initial station located in Sichuan, China. The pipelines are made of WPHY-65 steel produced in the USA and have good mechanical properties. It’s chemical composition and mechanical properties are shown in Tables 1 and 2. The experiment was conducted by using TSC-2M-8 MMM tester (Fig. 3) produced by Russian Energodiagnostika Company and the experimental data was processed by using MM-system software [4].
Mechanical properties of pipeline.
| Steel | Tensile strength (Mpa) | Yielding strength (Mpa) | Elongation |
|---|---|---|---|
| WPHY-65 | 530 | 450 | 705 |
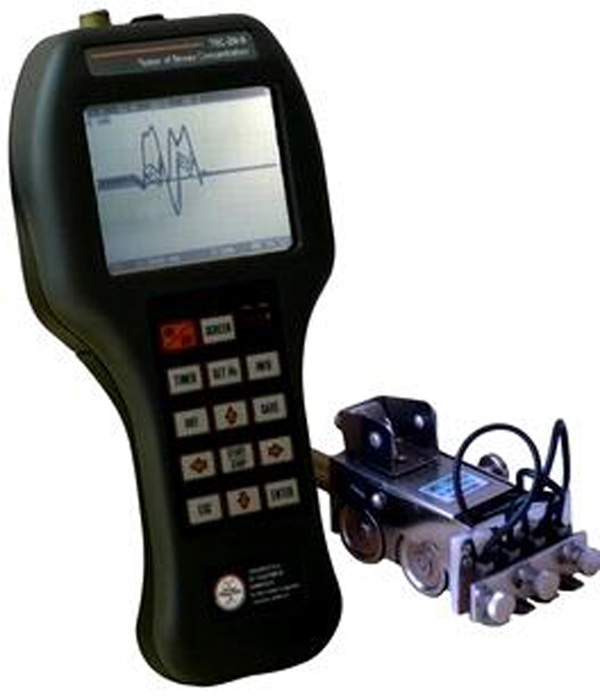 |
Fig. (3). TSC-2M-8 MMM tester. |
All together 20 pipelines have been tested in Puguang initial station, Fig. (1) shows the MMM tester including a scanning sensor and a magnetic indicator, Fig. (4) presents how to use MMM tester on pipeline. Testing procedures are as follows:
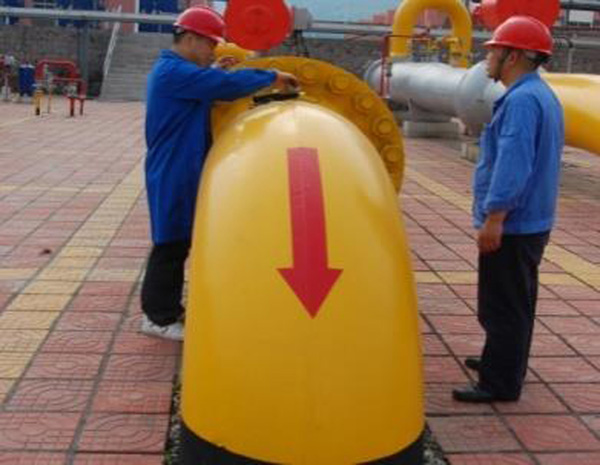 |
Fig. (4). MMM testing procedure. |
- (1) When diagnosing the welds, ferromagnetic scanning sensors are arranged vertically on the surface of the pipelines.
- (2) The MMM scanning sensors are moved slowly along the axis of the pipelines and cross the weld line.
- (3) A second operator records the testing data shown on the magnetic indicator and makes a mark on the surface of the pipeline when detecting abnormal sections.
20 pipelines have been tested with included 19 groups of T welds, 9 groups of straight weld seams and 11groups of girth welds (Table 3).
Number of analyzed weld seam types.
| Weld seam types | T weld | Straight weld | Girth weld |
|---|---|---|---|
| Number | 19 | 9 | 11 |
3. RESULTS AND ANALYSIS
3.1. Analysis of MMM Wave Diagram
As Figs. 5 through 7 shows, the smooth curve, above represents the magnetic field strength Hp, the lower line shows the strength of the magnetic field gradient dH/dX, and each color indicates different detecting directions. The axis of X signifies the length of the weld, the left side of Y-axis represents the value of magnetic field strength Hp, and the right side of Y-axis represents the value of magnetic field gradient dH/dX. The basic principles to justify the possible defect location by using MMM tests are according to the two criteria’s where the tangential component of magnetic flux leakage, Hp(y) perpendicularly oriented to the surface changes to its polarity and its gradient dH/dX reaches a peak value.
The 19 grouped T weld magnetic memory signal waveform displays an obvious “concave” shape. (Fig. 5) Specially, the green and blue lines fluctuate significantly, which respectively represent channel 3 and channel 7. All the wave lines are also distributed along the line of Hp(y) =0 A/m, the 0 value on the Y axis.
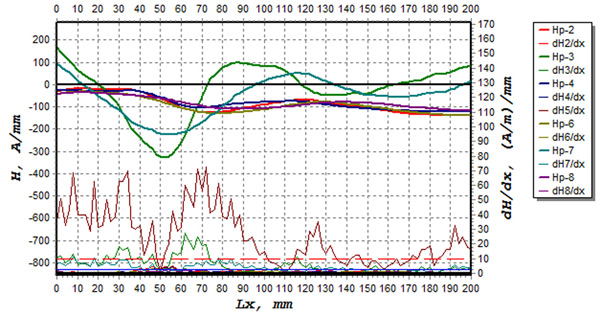 |
Fig. (5). MMM images of T weld magnetic memory signal waveform. |
Images generated from the 9 group of straight weld seam waveform shows a more gentle and linear trend (Fig. 6). Similarly, all the wave lines fluctuates along the line of Hp(y) =0 A/m.
While images obtained by the 11grouped girth weld waveform have regular ups and downs and the waveform changes obviously in the central and at both ends of the pipelines, showing a “mountain” shape (Fig. 7). Moreover, all the wave lines generated around line of Hp(y) =0 A/m.
Comparing the three types of weld seams separately, they appear to have different wave trends but still have something in common. Wave lines fluctuate along the line of Hp(y) =0 A/m, channel 3 and 7 fluctuates significantly. Therefore the line of Hp(y) =0 A/m can be used to present the location of the stress concentration zone. And channel 3 and 7 are sensitive to the change of magnetic signals, it may because its direction are closely related to the earth’s magnetic field direction which needs further discussion.
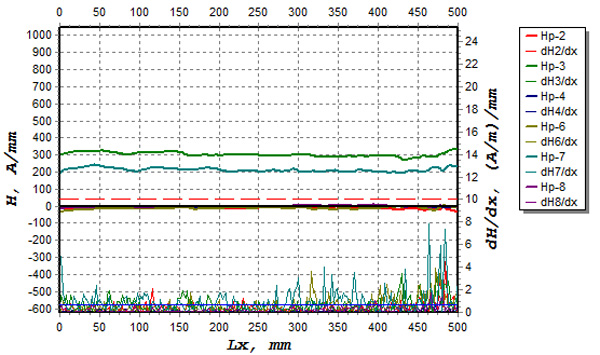 |
Fig. (6). MMM images of straight weld magnetic memory signal waveform. |
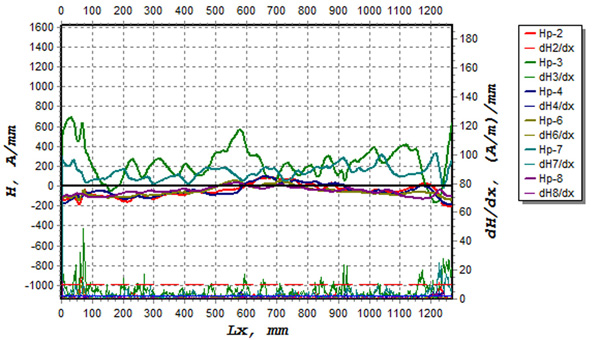 |
Fig. (7). MMM images of girth welds magnetic memory signal waveform. |
3.2. Mathematical Analysis of MMM Data
Results of 39 metal magnetic memory tests of weld seams are based on pipelines in Puguang initial station, MM-system software (Fig. 8) were used to process the MMM data to determine the following parameters:
 |
Fig. (8). MM-system software. |
- (1) The difference of the maximum and minimum values of the detection signal Hp(y).
- (2) The strength of the magnetic field gradient dH/dX.
- (3) The ratio of the maximum and average value of the magnetic field gradient m.
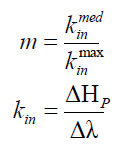 |
Δλ-The distance between the reference measurement channels; mm
kin-The value of magnetic field gradient between channels
kinmed-Average value of magnetic field gradient between channels
kinmax-The maximum value of the magnetic field gradient between channels
Comparing the mathematical analysis results of the three types of welds (Fig. 9), we can find different parameter ranges of T weld, straight weld and girth weld. Mathematical analysis results of the three types of weld seams are shown in Table 4.
 |
Fig. (9). Results of three types of welds. |
Ranges of mathematical analysis of MMM data.
| Weld types | ΔHp(y)( A/m) |
dH/dX (A/m)/mm |
m(x,z) | width (mm) |
|---|---|---|---|---|
| T weld | 400~600 | 50~60 | <10 | 50~160 |
| Straight weld | 200~300 | 20~40 | <20 | ― |
| Girth weld | 400~600 | 40~60 | <30 | ― |
CONCLUSION
Through quantitatively analyzing MMM characteristics of three weld seams, conclusions are as follows:
- (1) T weld, straight seam and girth weld are compared. Each weld seam has different characteristics. MMM images of T welds display an obvious “concave” shape with ΔHp of 200~600A/m, straight seam shows a more gentle and linear trend with ΔHp of 200~400A/m, girth welds waveform have regular ups and downs and the waveform changes obviously in the central and at both ends of the pipelines, showing a “mountain” font withΔHp of 400~600A/m.
- (2) The three weld MMM wave diagrams go through the line of Hp(y) =0 A/m. The line of Hp(y) =0 A/m can be used to predict the location of the stress concentration zone.
- (3) Characteristics of channel 3 and channel 7 lines are sensitive to the earth’s magnetic field, which should be emphasized in processing and interpretation MMM wave diagram.
- (4) For each pipeline engineering practice, types of defects can be identified based on magnetic anomaly signal waveform characteristics and quantitative MMM features which evaluate the pipeline defects quantitatively.
Quantitative detection of defects is a very important issue in the process of using non-destructive testing techniques. However, due to differences of test conditions in the use of magnetic memory technology, the test results are not universal. More systematic experimental study should be carried out to find the relationship between the defect of size, shape and magnetic memory parameters.
CONFLICT OF INTEREST
The authors confirm that this article content has no conflict of interest.
ACKNOWLEDGEMENTs
Thanks for the support of Marine public welfare industry research special funds project" Research and application of integrated submarine pipeline detection technology and risk assessment technology" (item number: 2013418026-3).


