
RESEARCH ARTICLE
Variations of Micropores in Oil Reservoir Before and After Strong Alkaline Alkaline-surfactant-polymer Flooding
Yongqiang Bai*, 1, 2, Yang Chunmei1, Liu Mei1, Jiang Zhenxue2
Article Information

Identifiers and Pagination:
Year: 2016Volume: 9
First Page: 257
Last Page: 267
Publisher Id: TOPEJ-9-257
DOI: 10.2174/1874834101609010257
Article History:
Received Date: 22/03/2016Revision Received Date: 10/08/2016
Acceptance Date: 21/09/2016
Electronic publication date: 30/11/2016
Collection year: 2016
open-access license: This is an open access article licensed under the terms of the Creative Commons Attribution-Non-Commercial 4.0 International Public License (CC BY-NC 4.0) (https://creativecommons.org/licenses/by-nc/4.0/legalcode), which permits unrestricted, non-commercial use, distribution and reproduction in any medium, provided the work is properly cited.
Abstract
Enhanced oil recovery (EOR) provides a significant contribution for increasing output of crude oil. Alkaline-surfactant-polymer (ASP), as an effective chemical method of EOR, has played an important role in advancing crude oil output of the Daqing oilfield, China. Chemical flooding utilized in the process of ASP EOR has produced concerned damage to the reservoir, especially from the strong alkali of ASP, and variations of micropore structure of sandstones in the oil reservoirs restrain output of crude oil in the late stages of oilfield development. Laboratory flooding experiments were conducted to study sandstones’ micropore structure behavior at varying ASP flooding stages. Qualitative and quantitative analysis by cast thin section, scanning electric microscopy (SEM), atomic force microscopy (AFM) and electron probe X-Ray microanalysis (EPMA) explain the mechanisms of sandstones’ micropore structure change. According to the quantitative analysis, as the ASP dose agent increases, the pore width and pore depth exhibit a tendency of decrease-increase-decrease, and the specific ASP flooding stage is found in which flooding stage is most affective from the perspective of micropore structures. With the analysis of SEM images and variations of mineral compositions of samples, the migration of intergranular particles, the corrosions of clay, feldspar and quartz, and formation of new intergranular substances contribute to the alterations of sandstone pore structure. Results of this study provide significant guidance for further application to ASP flooding.
1. INTRODUCTION
Enhanced oil recovery (EOR) methods are applied to oil reservoirs to obtain residual oil following primary exploitation and water flooding. Alkaline-surfactant-polymer (ASP) injection, an EOR method involving the infusion of alkali, surfactant and polymer mixture into the oil reservoir, has been researched and applied in the oilfields of China (especially in Daqing oilfield of China) and other countries for more than 20 years [1-4], and has proven successful due to its ability to improve displacement and sweep efficiency [5].
Alkali affects the micro-emulsion phase of oil and water by emulsifying crude oil by the in situ soaps accompanied with chemical reactions of alkaline and acid [6-8]. Meantime, the chemical reactions reduce oil-rock interfacial tension [8]. Surfactants decrease interfacial tension between trapped residual oil, water, brine and rock [9-11], and decrease the contact angle of water and matrix, making the oil wet matrix change to water wet [12, 13], thereby allowing an increased flow of oil, and are regarded as good agents for enhancing oil recovery since 1970s [14]. Viscosity of the liquid intermixture improves with polymer application, and the flow paths are plugged because of the interaction between polymer and matrix [15], which reduce water permeability and allow the oil-water emulsion to flow more through reservoir pores under large displacement force. This results in increased oil output with higher efficiency as less water accompanies the extraction [16, 17]. Especially, with the combined use of surfactant and polymer under an appropriate proportion and dose, the oil recovery may reach up to 40% [18].
ASP flooding as applied to the EOR method is accompanied by a series of challenges. Longtime used ASP flooding increased pump-sticking frequency, which made oil production cessation [19]. Furthermore, scaling formation and permeability damage [20, 21] derived from ASP flooding create an added area of concentrated concern and are not entirely understood [22], so to analyze the important control factors of permeability damage, micropore structure, during ASP flooding is necessary for well application of ASP flooding for EOR.
Micropore structure study of sandstone in the reservoir reveals and provides explanations for transformations within the reservoir’s macroscopic properties, providing insight to reservoir scale formation and permeability, especially quantified the formation damage [23]. In this study, outcrop core and reservoir core sandstone micropore structure variations are analyzed prior to and following strong alkaline ASP flooding. With the comparison analysis of outcrop core in different flooding stage in lab and reservoir core under longtime ASP flooding in oil field, we may determine which stage the flooding in the industrial production is beneficial for EOR. Rock samples were removed from the identical formation and position of the Daqing oilfield prior to and following 10 years of strong alkaline ASP flooding. Four stages, i.e. 10, 50, 100, 500 pore volume (PV) of laboratory strong alkaline ASP flooding for outcrop core before industrial production ASP flooding were completed. Cast thin section, SEM, AFM were employed to characterize the microstructure of sandstones qualitatively and quantitatively in every stage. Electron probe X-ray microanalysis (EPMA) was utilized to determine component change within the sandstones. Analysis results indicate that features and mechanisms of variations of microstructure of sandstones vary within stages of strong alkaline ASP flooding.
2. EXPERIMENTAL METHODS
2.1. Samples Selection
All the samples were collected from Daqing oilfield, one of the biggest oilfields in the world. The productions of Daqing oilfield has reached over 4.0×10⁷ tonnes every year for more than 40 years under the application of water flooding, polymer flooding and ASP flooding.
The core samples for laboratory ASP flooding were collected from group PI3 of well Xing 2-1-J29 in the No. 4 oil production plant of the Daqing oilfield where the well area location was water flooded for 3 years. Sample cores, extracted in 1998, were well stored on site in drill core stores at the Research Institute of Exploration and Development of the Daqing oil field. Porosity of samples was 27.2%, permeability was 961 mD and displacement pressure was 0.036 MPa.
Core samples of industrial production ASP flooding were collected for comparison analysis from group PI3 of well Xing 2-10-J3E7 which is located well Xing 2-1-J29 27 metres away. These core samples were extracted in 2008 and have been flooded with strong alkaline ASP for 10 years. Porosity of samples was 27.1%, permeability was 197 mD and displacement pressure was 0.077 MPa.
2.2. Flooding Agents
Composition of flooding agents utilized in laboratory ASP flooding replicated that utilized in the mining area with 1.2% wt alkaline (NaOH), 0.3% wt surfactant (Alkylbenzene sulfonate), and 1650 mg/L polymer (Hydrolyzed Polyacrylamide, HPAM). From the practical point of view, water used in flooding agents was underground water of mining well but not the pure water. The salinity of formation water was 6778 ppm, among which Cl- was 2363.5 ppm; K+ + Na+ was 2193.7 ppm; HCO3- was 2054.4 ppm; Ca2+ was 23.1 ppm; Mg2+ was 66.2 ppm; SO42- was 77.1 ppm.
2.3. Laboratory Flooding and Micropore Structure Representations
Core samples extracted for laboratory ASP flooding were cut into one inch diameter cylinders and sliced into pieces (Fig. 1). Samples were then segregated to be represented prior to ASP flooding and also to be represented at progressive flooding stages until 500 PV. For the reasons that the representation will destroy the samples and it is difficult to do the in-situ observations for micro representation, several parallel sample pieces were flooded simultaneously, and when the flooding reached to the given stage (10 PV, 50 PV, 100 PV, 500 PV), some of these stone pieces were taken out from core holder for various representations and the remaining were continuously flooded. The injection rate was 0.1~0.2 mL/min, and the flooding temperature was 45 degrees centigrade (matched to the temperature of flooding formation of mining area). After flooding, the surfaces of stone pieces were rinsed by distilled water for 5 minutes and naturally dried for SEM, AFM, and EPMA representations.
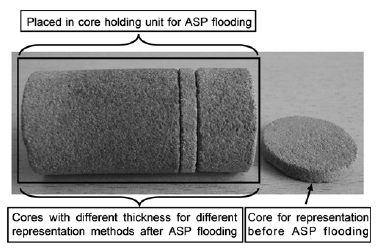 |
Fig. (1). Cores prepared for laboratory ASP flooding. |
3. RESULTS AND DISCUSSION
3.1. Morphology Analysis of Micropores Structure
SEM and AFM results from the selected samples reveal that micropore structures of sandstones retain specific features at various flooding stages (Fig. 2). Although the SEM and AFM both are the important scanning probe microscopy, the SEM images got by signals of electrons and the gray of images only represent the intensity of signals of electrons, while AFM images got by signals of force and the gray of images represent the intensity of force between AFM tip and sample or the altitude of sample surface, so they can show us the different characters of samples. Prior to laboratory flooding, particles in sandstones are complete with intergranular boundaries and retain clear appearance with clay particles loosely attached to the larger particles (Fig. 2), Original, SEM and AFM image). When flooding reaches 10 PV, small particles aggregate at the pores of the stone. By increasing the flooding agent, the small particles in the pores reduce (Fig. 2), 50 PV, 100 PV, SEM and AFM image), which indicates particles in the pores are driven away or dissolved, thereby the pores become enlarged (obviously be seen in Fig. (2), 50 PV, 100 PV, AFM images). Presence of residual flooding agents or new substances generated in sandstones during large flooding stage is then indicated by a bridge structure emerging in the small pores (SEM image, 500 PV) when the flooding stage reaches 500 PV causing particle surfaces to exhibit the state of convex point (AFM image). Change of positions of particles and the pore structures or pore surfaces mean that the micro structure property of sandstone has significantly changed with the ASP flooding process.
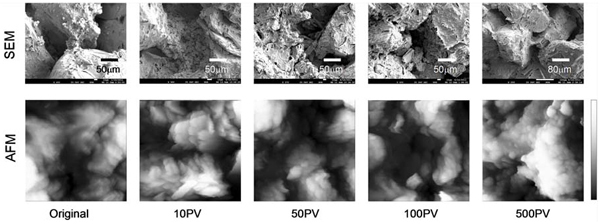 |
Fig. (2). SEM and AFM micrographs of different flooding stages. The AFM micrographs size is 10 μm × 10 μm. The right gray bar from black to white for AFM images represents the height from 0 μm to 4 μm. |
3.2. Quantitative Analysis of Micropores Structure
Qualitative analyzing of slight sandstone microstructure variations at various flooding stages through SEM images is quite feasible. Quantitative analysis, however, is challenged as the gray image of SEM does not sufficiently represent height and depth information of sandstone surface. AFM images do contain the three dimensions of information for sample surface, allowing the quantitative changes in separate ASP flooding stages to be derived. Following the quantitative derivation of the width and depth of sandstone micropores [24], the complete variation mechanism of sandstone micropores in distinct ASP flooding stages may also be achieved.
Fig. (3) illustrates the variation of micropore width counted from data in all AFM images of different places of one sample with 0.5 μm spacing in various ASP flooding stages (method of count please see Ref. [24]). Prior to laboratory ASP flooding, the small pores (pore width < 0.5 μm) are abundant with some large pore (pore width = 10 μm) consistencies (Fig. 3A), which are in the original state. In the early ASP flooding stage, small pores (pore width < 0.5 μm) mostly reduce while large pores increase and pores with width 10 μm disappear (Fig. 3B and C). This phenomenon means that the fine particles are washed out of stone sample with flooding fluid (the fine particles can be seen in the draining of flooding by eyes and microscopy) or flock to some large pores. At middle and later ASP flooding stages, small pores increase (Fig. 3D and E) and large pores markedly decrease (Fig. 3D), pore width shifts from 6.5 μm to 9.0 μm) with a slight recovery of the largest pores (Fig. 3E), pore width = 9.5 μm and 10 μm) at the later ASP flooding stage. These mean that some new small pores emerge and new structures generate and block some large pores. The complex transformation of pore width indicates multiple mechanisms in flooding which comprehensively determine the variations of shapes of sandstone pores.
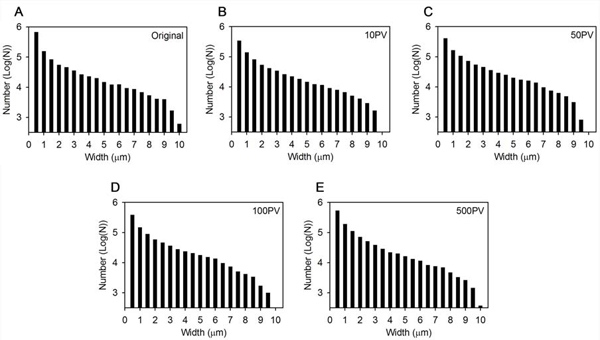 |
Fig. (3). Width distributions of pores at different flooding stages. |
The AFM image, representing the surface depth of sample, is utilized to count depth of micropores (Fig. 4) for a full micropore analysis at various flooding stages. Prior to laboratory flooding, the pore depths distribute more evenly with characteristic peaks at 0.6 μm, 1.6 μm, and 3.8 μm (Fig. 4A). These peaks mean that the distribution of pore size is not uniform, and different characteristic peaks present the different pore structure property. Following 10 PV ASP flooding, peak of 0.6 μm increases, and peak of 3.8 μm disappears, simultaneously, the percentage of larger pores decrease wholly (Fig. 4B), peak of 3.2 μm to peak of 4.0 μm). Following 50 PV ASP flooding, percentage of pores with 0.6 μm decreases and peak of pore depth shifts to 0.8 μm (Fig. 4C) and the percentage of large pores rebound. Following 100PV ASP flooding, the variation of pore depth mainly concentrates in small pores (Fig. 4D, peak of 0.2 μm to peak of 0.8 μm) with small pores decreasing and peak recovery reaching 0.6 μm. As ASP flooding reaches 500 PV, pore depth distribution is nearly unchanged. Pore sizes exhibit different behavior at varying ASP flooding stages as observed in the statistical analysis. These mean that the ASP flooding changes the pore structure character, but in different flooding stages, the changes are different for different pore size.
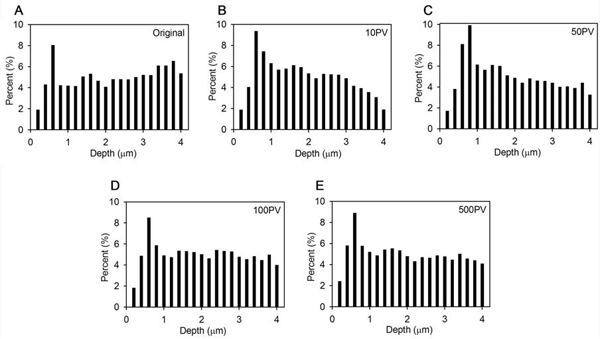 |
Fig. (4). Depth distributions of pores at different flooding stages. |
Fractal is the natural phenomenon that exhibits a repeating pattern at every scale. Fractal dimension is often utilized to describe the geometrical complexity of porous medium or the imbibition process of wetting fluid into porous media [25, 26]. The slope of a double logarithmic characteristic length relates to the fractal dimension. A more complex porous medium geometry indicates a larger fractal dimension. (Fig. 5) illustrates dual-segment linearity of logarithms for number of pores with depth L (number of characteristic length, N(L)) versus logarithms of pore depth (characteristic length) counted from AFM images. Fractal dimensions (D=d(LOG (N (L)))/d(LOG (L))) of section 1 (small pore, D1) are from 1.75 to 2.07 and fractal dimensions of section 2 (large pore, D2) are from 0.81 to 1.04 with ASP flooding stages. The alternation of fractal dimension indicates the complexity of sandstone pore behavior, allowing analysis to determine a superior ASP stage from the perspective of pore geometry.
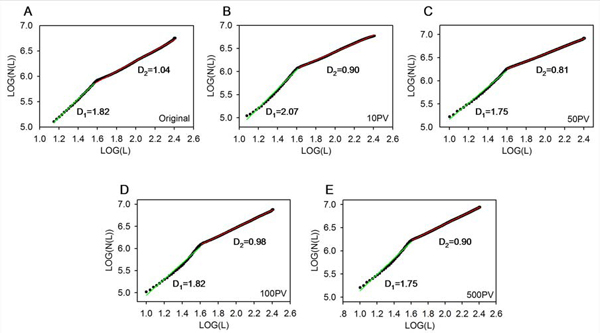 |
Fig. (5). Graphical plots of logarithms of number of pore with depth L versus logarithms of pore depth. Green and red lines show the linear fit of two scatter spots segments. |
Fig. (6) presents the comparison of mean pore width (PW), mean pore depth (PD), and fractal dimensions (FD1 and FD2) with ASP flooding stages. As the ASP dose agent increases, the pore width and pore depth exhibit a tendency of decrease-increase-decrease. Fractal dimensions of two sections are also correlated with the variation of mean pore width and mean pore depth. Continual increase in the dose of ASP agent at 100PV, results in fractal dimensions increase from the minimum value as the mean pore width and mean pore depth reach maximum value, indicating that 50 PV~100 PV ASP flooding is the superior ASP flooding stage for the points of fractal theory and pore structures. As ASP continues, mean pore width or mean pore depth decreases, indicate that pore structure worsens and ASP flooding is harmful. Fractal dimensions, mean pore width and mean pore depth derived from sandstone in field operation (FO) of ASP flooding (group PI3 of well Xing 2-10-J3E7 injected less than 1.0 PV ASP slug for ten years, for the reason of economic efficiency (outputting of oil decreased), which was not worth to be flooded with ASP) effectively match that at stage of 500 PV.
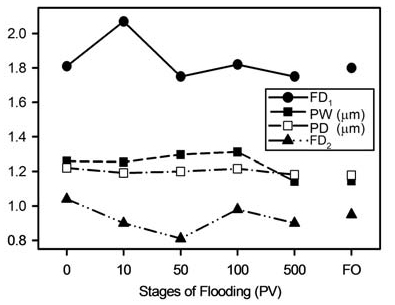 |
Fig. (6). Comparison of mean pore width (PW), mean pore depth (PD), and fractal dimensions (FD1, FD2) at different ASP flooding stages. |
Although the doses of ASP flooding utilized in the laboratory are different from the field operation (The account mode of dose of ASP is different between laboratory and the field operation. In the field operation, the dose of ASP is averaged by reservoir, and is seldom large than several PVs, but the dose of ASP is impossible to flow all the reservoir, so it is possible that there are several hundreds PVs dose of ASP flow through the special areas of reservoir.), the change behavior of pore structure in sandstones is acceptable for oil industry. It means that in order to obtain good industry oil displacement effect, the ASP flooding project should be changed when the field ASP flooding gets to some certain stage, such as the alkaline preflush method or low concentration of alkali and weak alkali used for ASP flooding and so on.
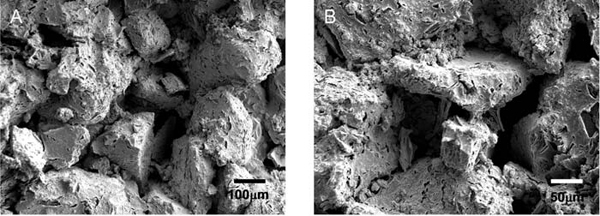 |
Fig. (7). Distribution of intergranular particles before ASP flooding (A) and after 10 PV ASP flooding (B). |
3.3. Mechanisms of the Variations of Micropores Structure
The microspore structures of sandstones transformed in ASP flooding as illustrated above. Complicated mechanisms involving physical and chemical interaction in the flooding process may determine the micropore behavior response.
3.3.1. The Migration of Intergranular Particles
(Fig. 7) depicts the distribution of intergranular particles prior to ASP flooding (Fig. 7A) and after 10 PV ASP flooding (Fig. 7B). Small particles attached to the surface of larger sandstone particles prior to ASP flooding, following 10 PV ASP flooding, the small particles shifted and mainly located along edges of pore (Fig. 7B). Meantime, the fine particles can be seen in the draining of flooding by eyes and microscopy. Migration of intergranular particles (mainly clay) at early ASP flooding stage initiates damage as reflected in the reduced mean pore size of sandstones (Fig. 6).
3.3.2. The Corrosion of Clay
As flooding time increases, chemical interactions of alkali in ASP and the reservoir become apparent. Corrosion of clay exemplifies this interaction as the presence of active clays clearly influences the effect of ASP flooding [22]. Fig. (8) depicts common worm-like kaolinite prior to ASP flooding (Fig. 8A) and seldom found and the surface of sandstone particles become smoothly (Fig. 8B). X-Ray analysis (Fig. 9) reveals the percentage of kaolinite decrease from 7% (original) to 5%, 4%, 3% as ASP flooding increases from 0 PV to 10 PV, 50 PV, and 100 PV.
 |
Fig. (8). Corrosion of clay before ASP flooding (A) and after 50 PV ASP flooding (B). |
3.3.3. The Corrosions of Feldspar and Quartz
Fig. (9) also reveals ASP flooding correlations with corrosions of feldspar and quartz. As ASP flooding increases, potassium feldspar continuously decreases while quartz experiences significant variations. The silica acid radicals react with hydroxyl of alkaline in ASP agents and produce aluminum hydroxide, leading to the feldspar reduction. Quartz transforms as weak crystalline or amorphous SiO2 retains a strong active silane bond, therefore, H2O, Na+, K+, and OH- are provided access into the quartz lattice, thus generating soluble Si(OH)3-.
Fig. (10) illustrates the comparison of quartz corrosion and feldspar prior to ASP flooding (Fig. 10A) and after 100 PV ASP flooding Fig. (10B). Regularly shaped feldspar and quartz become uneven after 100 PV ASP flooding, and mean pore size of sandstones is simultaneously enlarged (Fig. 6).
3.3.4. The Formation of New Intergranular Substance
New structures are formed between the particles of sandstones as ASP flooding increases. (Fig. 11) depicts intergranular character of sandstone after 500 PV ASP flooding. Casting slice and SEM images depict sheet structures with 5~10 μm thick emergence (Fig. 11A and B), as indicated by red arrows). These structures do not appear in lesser ASP flooding stages. Sheet structures are mostly bridging styles between particles of sandstones (Fig. 11B, C). These scaling shaped sheet structures indicate secondary mineral precipitation particularly for NaOH [27], explaining decrease of pore size in the 500 PV ASP flooding stage (Fig. 6).
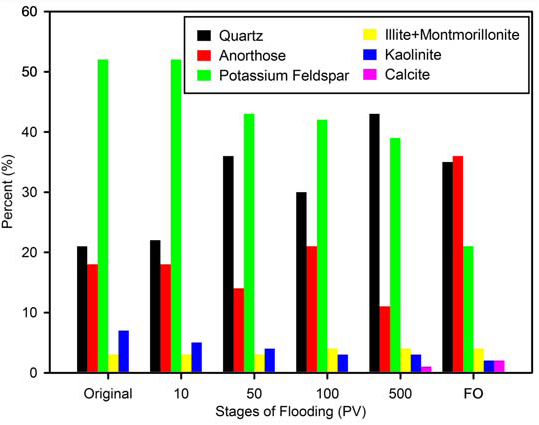 |
Fig. (9). Quality percents of mineral in sandstones at different ASP flooding stages. |
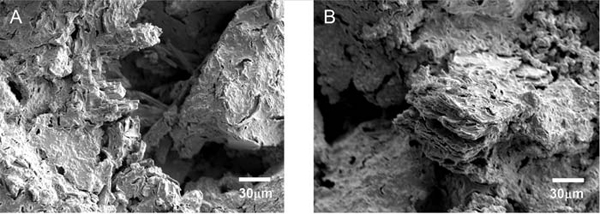 |
Fig. (10). Corrosion of quarts and feldspar before ASP flooding (A) and after 100 PV ASP flooding (B). |
 |
Fig. (11). Intergranular character of sandstone after 500 PV ASP flooding. (A): Casting slice image; (B): SEM image; (C): Amplified of middle part of image B. |
The intergranular precipitate, mainly silica, is consistently produced in the process of ASP flooding. Fig. (12) presents the quality percentage of intergranular substance attained by electron probe micro-analysis (EPMA). In the process of ASP flooding, the proportions of Al2O3 (part components of kaolinite and feldspar) decrease with the corrosions of clay and feldspar, while the SiO2 increase forming scale and precipitate between particles of sandstones.
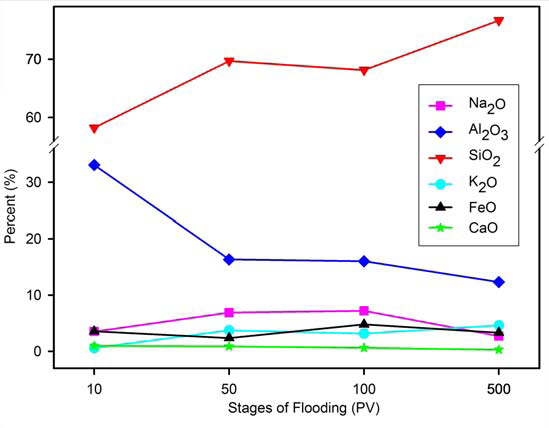 |
Fig. (12). Quality percents of intergranular substance at different ASP flooding stages. |
CONCLUSION
1) In the process of strong alkaline ASP flooding, pore structures of sandstones experience significant change at various flooding stages.
2) Factors utilized in quantitative analysis of pores to determine superior ASP flood stages are, pore width (PW), mean pore depth (PD), and fractal dimensions (FD1, FD2). Research evaluated change pore structure with the ASP flooding from 10 PV to 500 PV revealing the best displacement effect at the stage of 50 PV~100 PV ASP flooding.
3) The migration of intergranular particles, the corrosions of clay, feldspar and quartz, and formation of new intergranular substances contribute to alterations in sandstone pore structure.
CONFLICT OF INTEREST
The authors confirm that this article content has no conflict of interest.
ACKNOWLEDGEMENTS
We thank follows financial support of the research: National Natural Science Foundation of China (51274068, 41472112); China Postdoctoral Science Foundation (2014M560163) and open project of Key Laboratory of Enhanced Oil Recovery, Ministry of Education of China (2014).