
RESEARCH ARTICLE
Research and Simulation on Solids-Conveyance Law of the Shale Shaker
S.Z. Zhou, S. Zhang*, Z.P. Lv, L. Qin
Article Information

Identifiers and Pagination:
Year: 2016Volume: 9
First Page: 33
Last Page: 43
Publisher Id: TOPEJ-9-33
DOI: 10.2174/1874834101609010033
Article History:
Received Date: 12/11/2014Revision Received Date: 01/09/2015
Acceptance Date: 22/09/2015
Electronic publication date: 31/03/2016
Collection year: 2016
open-access license: This is an open access article licensed under the terms of the Creative Commons Attribution-Non-Commercial 4.0 International Public License (CC BY-NC 4.0) (https://creativecommons.org/licenses/by-nc/4.0/legalcode), which permits unrestricted, non-commercial use, distribution and reproduction in any medium, provided the work is properly cited.
Abstract
This work presents a numerical study on the solid particles conveyance behavior of a shale shaker used in oil production. The particle flow is simulated by discrete element method based on Soft-Sphere model and Hertz-Mindlin contact model. Two important factors, conveyance velocity and filter ratio, are selected to describe the working performance of shale shaker. The influences on that of three important working parameters, vibration frequency, excitation directions, screen slope, are studied. The results show that conveyance velocity is approximately linearly related to the three factors. In addition, particle size has a great influence on conveyance velocity as well. Filter ratio decreases with the increase in vibration frequency, while the two other factors have little influence on it. So appropriately increasing vibration frequency on the premise of satisfying the structural strength of shale shaker can not only increase movement speed, but also reduce the filtering ratio.
1. INTRODUCTION
A shale shaker as the first-stage solid control equipment is a kind of vibration screenused widely in the oil production for solid/liquid separation [1]. Its performance and capacity is influenced greatly by conveyance of solid particles. In hence, the study on conveyance regularity of solid particle is a research focus in the oil filed.
As Fig. (1a) shown is an actual structure of shale shaker. In this paper, he focus is on conveyance process of particles, the supporting beam, wedge block, stiffener which has nothing to do with it are neglected.The schematic diagram of shale shaker is achieved, as Fig. (1b) shown. The excitation shaft is equipped with two motors to provide shaking force to screen through screen cradle. It forces the screen vibrating both in vertical and horizontal directions, but the particle inlet stands still. Particles firstly fall to the screen from the particle inlet and then move forwardly and upwardly as the vibration of screen. Usually the x-velocity component of particles is called conveying speed vx, which is one focus in this paper. In order to improve the performance of drilling fluid recovered, the sieve pore is very small at the micron scale. So most particles can move out from the right particle outlet, but some particles of which the diameter are smaller than the sieve pore may pass through the screen, it impairs the performance of recovered drilling fluid. The ratio between passing particles and all particles is defined as filter ratio, which is the other focus in this paper.
Although the shale shaker is traditional equipment in oil industry, most of the researches are focused on the structural strength and dynamic behaviors [2, 3]. Due to the complex interactions between particles and screen, the research on movement of particles is nothing much, but some simple models have been proposed. For example, Manohar La and L.L Hoberock have built the solids-conveyance model based on the physics of the problem, but the model is simplified as a single particle and the interactions between particles have been neglected. The pore opening and particles of shale shaker are so small that a perfect way to research the solid-conveyance problem is still not worked out.
The Discrete Element Method (DEM) derives from the 1970s, which is a kind of highly non-linear numerical method. It can describe the movement on a particle scale, which can help the researchers have an insight into understanding the complex screening process and developing the motion law of particles on the screen. DEM has been applied widely in the study of particle flow in mining industry and agriculture vibration screen and turned out to be very useful in understanding the fundamentals of the screening process [4-9]. But the differences between these kinds of vibration screens and shale shakers are huge, which include structural characters, particle content and sizes, work environment and working parameters and so on. So the research results on vibration screens used in the other fields are not suitable for petroleum shale shaker. In this work, we adapt the DEM model for this specific shale shaker used in petroleum industry. The mathematical model of solid particles moving on the screen has been built, based on which the simulation conditions are proposed. The changing laws of particles conveying speed and filter ratio of shale shakers had been achieved, which will be helpful in the structural design and practical work of shale shaker.
2. MODEL DESCRIPTION
2.1. Model of Particles
The contact force produced by particles coming into collision with each other is very complex, which is usually simplified into Solf-Sphere Model as the Fig. (2) shown. Spring, damper, slider and coupler are introduced to describe contact behavior. So the contact force can be equivalent to the composition of elastic force Fk and damping Fs force. They are acted on the particles by the spring and damper [10]. The coupler is applied to establish the matched relationship between the particle-particle collisions; it doesn’t involve any force calculation. The sliding between particles caused by normal force and friction is realized by slider. The two parameters elastic coefficient k and damping coefficient C are introduced to quantify the effect of spring, damper and slider.
 |
Fig. (1). Structure of the shale shaker. |
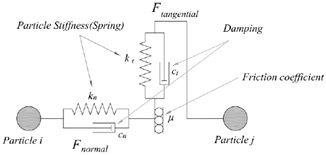 |
Fig. (2). Soft-sphere model. |
Set a 3D spherical particle as number i, when it crashes into the other particle as number j, the contact force and moment acted on it can be expressed as:
 |
(1) |
When particle i is contacting with multiple particles, the total force and moment can be expressed as:
 |
(2) |
Where Fijn and Fijt are the normal and tangential contact forces between particle i and j respectively, They can be expressed as:
 |
(3) |
 |
(4) |
Where, Fkn and Fsn are normal elastic force and damping force respectively, Fkt and Fst are tangential, αr is the normal overlapping, vij is the relative velocity between particle i and j, n is the unit vector from the center of particle i to j. kn and cn are the normal elastic coefficient and normal damping coefficient, kt and ct are tangential elastic coefficient and tangential damping coefficient, vct and δ are the sliding velocity and tangential displacement at contact point, among them vct can be given as:
 |
(5) |
Where, Ri and Ri are the radius of particle i and j respectively, wi and wj are the angular velocity.
2.2. Contact Model
Contact model is an important foundation of DEM. The particle model provides a method for solving contact force, while the contact model decides directly the value of Fi and Ti. In order to solve different kinds of particle collision questions, two contact models can be applied to this simulation. They are Hertz-Mindlin and Hertz-Mindlin with JKR Cohesion. Hertz-Mindlin contact model is built based on both Hertz Theory and Mindlin-Deresiewicz Theory. It takes the energy loss generated by collision into consideration by calculating elastic force Fk and damping force Fc [11, 12]. It’s also the theoretic foundation of the other contact model Hertz-Mindlin with JKR Cohesion, which is based on JKR Theory and considers the effect of adhesion between wet particles on the base of Hertz Theory [13, 14].
During the working process of shale shaker, solid particles are submerged into the drilling fluid, but the content of them is very low. The distance between particles is far shorter than the critical distance of forming a liquid bridge [15]. So in the conveyance process of particles, adhesion forces have no chance to come into being. And as the experiment tested, the solids-conveying velocities before and after the liquid endpoint are matched once a steady state is achieved. It’s more reasonable to choose the Hertz-Mindlin as the contact mode in this work, based on which the motion equation of any single particle can be determined as:
 |
(6) |
Where, m* is the equivalent mass of two collision particles, I* is equivalent moment of inertia, S is radius of gyration, un, us are normal and tangential displacement respectively. θ is rotation angle of particle. Gn and Gt are the normal and tangential components of gravity. Fn ,Ft, T are expressed as formula (1)~(2).
3. SIMULATION CONDITIONS
3.1. Model of Vibration Screen
The 25 meshes screen with square hole is selected as the research object, the aperture of which is a=0.71mm and the aperture ratio is 48.83%. Scale-down geometries of shale shaker are used in the simulation to reduce the computational effort, which is shown in (Fig. 3). In x, y direction the scale factor is 1/10. Because the movement of particles in z direction is not the focus point in this work, the scale factor in this direction is selected as 1/50. The dimensions of mesh and the aperture, which are critical to the conveyance behavior of particles, are as the actual ones.
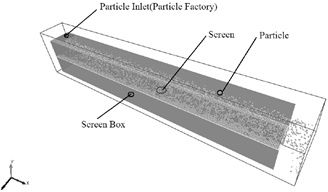 |
Fig. (3). DEM simulation model of vibration screen. |
3.2. Distribution of Particles
The whole simulation process lasts 2s at a particle generation rate of 4000 particles/s. 8000 spherical particles are involved in the calculation. For 25meshes screen, it is mainly used for sieving particles whose diameters range from 0.3~2mm [16]. So According to the difficulty of sieving, the particles can be divided into three parts: easily through the screen pole, hardly through and cannot through. Usually the average dealing capacity of a shale shaker is 0.05m3/s, in which the solid phase occupy 11~19.8% [17]. Normally in order to keep the performance of drilling liquid, the shale shaker should guarantee mostly particles cannot pass through the screen pole. So in this simulation 70% of the particles are cannot through type. The specific distribution of particles in this paper is established and shown in Table 1. When the density of drilling liquid is 1200 kg/m3, particle is 2600 kg/m3, it's not hard to find out that the solid phase occupy 18.5% of the drilling liquid of a small-scaled shale shaker.
3.3. Simulation Parameters
In this work, the simulation is achieved based on Hertz-Mindlin contact model. The mainly parameters are shown in Table 2, which are coming from the experimental data and other research results [4, 18].
3.4. Screening Process of Particles
The solids-conveyance process is simulated based on parameters in (Table 2). As Fig. (3) shown, particles move upward and forward on the screen as the vibration of shale shaker. They can be transported out on the effect of particle-particle and particle-screen interactions.
During the working process of shale shaker, the throwing motion of solid particles can not only accelerate the solid-liquid separation, but also improve the conveying velocity. In theory, once the structure and working parameters have been determined, the throw index D of linear shale shaker is a constant value. According to the formulation of throw index, it can be calculated as:
 |
(7) |
where, λ is the amplitude, unite is m, f is the vibration frequency, δ is the excitation directions, α is the screen slope, g is the gravitational acceleration. The throw index can be calculated according to the data shown in Table 1, is 3.89. According to the research results of predecessors, when throw index is bigger than 3.3, the shale shaker will have a better performance [18]. So this shale shaker can work in a good condition.
Distribution of particles.
Easily through =0.5~0.7
 |
Hardly through
=0.7~1 |
Cannot through
=1~3 |
||||
|---|---|---|---|---|---|---|
| Dimension (mm) | 0.3 | 0.4 | 0.5 | 0.7 | 1.6 | 2 |
| Number(particles /s) | 160 | 240 | 400 | 400 | 1600 | 1200 |
| Percentage | 4% | 6% | 10% | 10% | 40% | 30% |
| Total particle number | 320 | 480 | 800 | 800 | 3200 | 2400 |
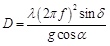
But in practical working conditions, the randomness and arbitrariness of particle-particle collision will result in the inconstant of throw index D, as Fig. (4) shown.
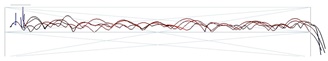 |
Fig. (4). DEM simulation model of vibration screen. |
4. INFLUENCE OF WORKING PARAMETERS ON CONVEYANCE VELOCITY
It's known to us that the behavior of particles is influenced mostly by interaction of particle-particle and particle-screen. Working parameters and the structure parameters decide the contact force directly. They are important to the conveyance velocity vx. In this work, the effects of main working parameters vibration frequency f, excitation directions δ, screen slope α have been discussed. The initial values of these parameters are shown in (Table 2).
Main parameters used in simulation
| Parameters of vibration and structure characteristic | Initial Value | Unit |
|---|---|---|
| Amplitude λ | 4 | mm |
| Vibration frequency f | 18.5 | Hz |
| Excitation directions δ | 45 | degree |
| Screen slope α | 0 | degree |
| Parameters of Collision | Particle | Shale shaker |
| Poisson ratio v | 0.2 | 0.3 |
| Shear modulus G(Pa) | 5×10⁷ | 7×10¹⁰ |
| Density p(kg/m3) | 2600 | 7800 |
| Parameter of Collision | Particle-Particle | Particle-Shale shaker |
| Coefficient of Restitution ek | 0.003 | 0.4 |
| Coefficient of Static Friction µs | 0.3 | 0.5 |
| Coefficient of Rolling Friction µr | 0.01 | 0.002 |
Because the randomness and arbitrariness of particle-particle collision, conveying velocity of single particle is irregular. So the average conveying velocity of particle group is regarded as the conveying velocity vx of shale shaker. It is plot as Fig. (5) shown; the conveying velocity vx tends to be a stable value 0.251m/s. It is compared with the experimental and theoretical value. The results are shown in (Table 3).
Comparison of movement speed among EDEM, the-oretical and experimental value.
| Theoretical value | Experimental value | EDEM simulation value | ||
|---|---|---|---|---|
| Conveying velocity vx (m/s) |
0.291 | 0.270 | 0.251 | |
| Error | 7.8% | 7.03% | ||
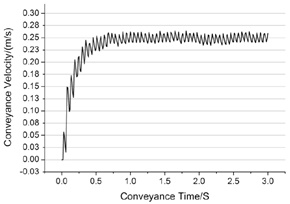 |
Fig. (5). Conveying velocity curve of particles. |
As Table 3 shown, the error of EDEM simulation value is slightly smaller than the theoretical value.The result shows that the EDEM simulation has a higher accuracy. In addition, EDEM simulation method can obtain more information on particles, such as the distribution of particle group on screen, contact force between particles, filtering ratio of particles and so on. It has more much advantage.
4.1. Influence of Vibration Frequency
The variation range of vibration frequency f during the working of shale shaker is 16-26 Hz [19]. Keeping the other parameters unchanged, the conveyance processes are simulated when vibration frequency is 16 Hz, 18.5 Hz, 20 Hz, 22 Hz, 24 Hz, 26 Hz respectively. The results are shown in (Fig. 6).
(Fig. 6) shows that the conveyance velocity vx is increased with f and they have an approximately linearly relationship. As the frequency increases, the moving activity of particles will enhance, the particles have more chances to contact the screen to get energy and complete throwing motion. So the particles can move in a higher conveyance velocity. In addition, conveyance velocity vx is related to particle diameter d. The d is smaller, the contact force calculated by Hertz-Mindlin will be smaller. According to formulation (6), the vx will be smaller. However, as the increase of vibration frequency, the vx growth rates of different size particles keep almost the same.
 |
Fig. (6). Relationship between f and vx. |
4.2. Influence of Excitation Directions
Normally, the screen slope of shale shaker is very small. In order to make the particles move forward on screen, an excitation direction δ is applied to the screen deck. So the particles are able to have a horizontal velocity component. Keeping the other parameters unchanged, the conveyance processes are simulated when excitation direction δ is 30°,40°,45°,50°,60°,70° respectively. The results are shown in Fig. (7).
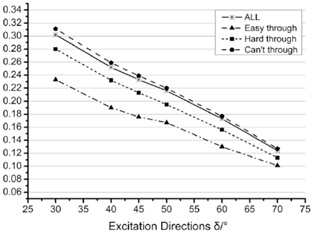 |
Fig. (7). Relationship between δ and vx. |
As the increase of excitation direction, the y-component excitation force of shale shaker is increased, the particles can jump higher, but the x-component excitation force is decreased. And in once throwing motion, the distance that particles move forwardly is shorter. If the excitation direction is too big, it will lead the particles to splash on the screen deck. So as the Fig. (7) shown, the conveyance velocity vx decreases with the increase of excitation direction δ. And the velocities of different size particles tend to be consistent with each other. During the working process of shale shaker, too abundant diversities of conveyance velocity between different size particles will increase the filter ratio of the small particles. So smaller excitation direction δ does not mean high screening performance, usually δ ranging from 40° to 60° would be better.
4.3. Influence of Screen Slope
There are two kinds of screen slope of shale shaker. One with negative slope α <0, of which the screen slopes down, can improve the conveyance velocity effectively. But it will cause the drain of drilling fluid and conveyance instability of particles. The other one with positive slope α>0, of which the screen slopes up, is beneficial to increase the capacity of drilling fluid. But too large slope angle will result to particles accumulation around the inlet. The screen slope of linear shale shaker usually ranges from -5°~+5°. Keeping the other parameters unchanged, the different conveyance processes are calculated when screen slopeis -2°,-1°,0°,1°,2° respectively. The results are shown in (Fig. 8).
As Fig. (8) shown conveyance velocity vx decreases as the increase of screen slop. And the reduction tends to be smooth and lightly. The decrease tendency of different size particles is basically same with each other. As the increase of screen slope, screen slopes up gradually, the x-component force of gravity will prevent the particles moving forwardly, so the conveyance velocity will decrease.
|
Fig. (8). Relationship between α and vx. |
5. INFLUENCE OF WORKING PARAMETERS ON FILTER RATIO
In the process of screening, not all of the particles satisfied d/a<1 would pass through the screen pore. Only partly small particles can be transported out from the right side outlet under the effect of interactions of particle-particle and particle-screen. More particles pass through the screen pore, the lower performance of drilling fluid will be. So filter ratio is another important factor to measure the working performance of shale shaker.
For the particles, of which diameter is bigger than screen pole, they can’t pass through the sieve aperture. So it makes no sense to research its filter ratio. In this work, the research on filter ratio is focus on particles, of which diameter is smaller than screen pole. The filter ratio is defined as the following formula.
 |
(8) |
Where, ndi is the number of particles (diameter di) that pass through the screen. Ndi is the total number of particles during the whole simulation.
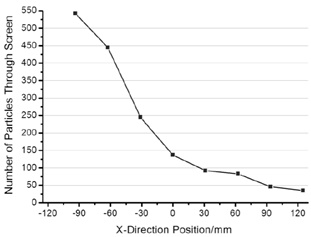 |
Fig. (9). Distribution of filter amounts. |
In order to study the varying pattern of filter ration along screen, the screen plane is divided into 8 sections. As Fig. (9) shown is the number of particles along the screen that can pass through the sieve pore during the whole simulation process. It can be easily deduced that the filter ratio of particles decreases along the screen from inlet to outlet. The accumulation of particles around the inlet will increase the filter ratio. So in order to reduce the stacking condition and decrease filter ratio, it would be better that particles there can be conveyed forwardly by throwing motion as soon as possible.
5.1. Influence of Vibration Frequency
The vibration frequencies f studied in this part keep in the same with Part 4.1 while keeping the other parameters unchanged. The calculation results and variation tendency of filter ratio are shown in (Fig. 10). It's not hard to find that the filter ratio of particles satisfied d/a<1 reaches to 65.96% and that of easily through particles is 90%. It shows most of particles satisfied d/a<1 will pass through the screen, only fewer can be transported out on the effect of interaction of particle-particle and particle-screen.
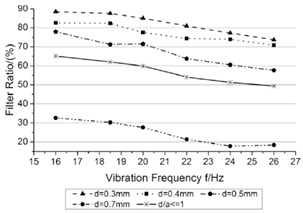 |
Fig. (10). Relationship between f and η. |
As the vibration frequency increases, the move activity of particles improves. It will decrease the contact time when the particles hit the screen, and then reduce the possibility that the particles pass through the sieving pole. As Fig. (10) shown, the filter ratio decreases as the improvement of vibration frequencies f obviously. For the easy through particles, which satisfy d/a<1, keep a high filter ratio over 70%.
5.2. Influence of Excitation Directions
The excitation directions δ studied in this part keep in same with Part 4.2 while keeping the other parameters unchanged. The calculation results and variation tendency of δ are shown in (Fig. 11). As the increase of excitation direction, the conveyance velocity improves, but the activity of particles doesn't enhance. In hence, the excitation directions δ increase, the filter ratio only has a small fluctuation, but overall the whole filter ratio of all particles does not change too much.
 |
Fig. (11). Relationship between δ and η. |
5.3. Influence of Screen Slope
The screen slopes studied in this part keep in same with Part 4.3 while keeping the other parameters unchanged. The calculation results are shown in (Fig. 12). On the one hand, the screen slopes up gradually as screen slope α varies from -2° to 2°. Particles will accumulate around the inlet, and the filter ratio will increase. On the other hand, the angle change is very small, so the variation of filter ration is very slight.
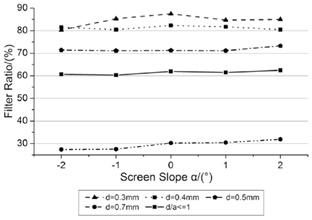 |
Fig. (12). Relationship between α and η. |
Among the three parameters, vibration frequency has the greatest impact on filter ratio. Increasing vibration frequency can not only improve the conveyance velocity of particles but also decrease the filter ratio. However it’s restricted by the strength requirement [20]. The vibration intensity formula k=λ(2πf)2/g shows that vibration intensity k and frequency f of the second direct ratio. The vibration intensity increases sharply along with vibration frequency, which puts forward higher requirements on the strength of the shale shaker. Therefore, when the workers want to improve the working performance of shale shakers by increasing the vibration frequency, the structure strength requirement of shale shaker should be taken into consideration.
CONCLUSION
In this work, a DEM model has been developed to research the screening process of a shale shaker in oil field. The laws of conveyance velocity and filter ratio have achieved, which can be concluded as follows.
- Solid particles move forward mainly depend on throwing motion. Due to the randomness and arbitrariness of interaction between particles, throw index is a dynamically varied value.
- The conveyance velocity vx of solid particles is approximately linearly related to vibration frequency f, excitation directions and screen slope. The smaller vibration frequency f, the less vx will be. The particle size has great influence on conveyance velocity, but the sensitivity of different size particles to vibration frequency and screen slope is approximately consistent with each other, while excitation directions have greater influence on big particles. As the increase of the excitation direction, conveyance velocity of big particles decreases more quickly.
- The filter ratio reaches to the maximum value around particle inlet and decreases along the screen. Therefore particles around the inlet should be conveyed forwardly as soon as possible to reduce the stacking condition and decrease the filter ratio of particles. Comparing with conveyance velocity, filter ratio is affected by vibration frequency more obviously, while the other two parameters have less influence on it. In hence, with the structure strength of shale shaker satisfied, appropriately increase of vibration frequency can not only improve the conveyance velocity but also decrease the filter ratio.
- Through comparing theoretical value, experiment value and simulation value, the results show that screening process can be investigated on a particle scale by DEM model. The influences of main working parameters on conveyance velocity and filter ratio respectively can be achieved effectively. The DEM simulation can not only reduce the testing time and cost, but also provide references for theoretical research on solid conveyance. In addition, on the base of research results in this work, the couple model of drilling fluid and particles can be built in the next study.
CONFLICT OF INTEREST
The authors confirm that this article content has no conflict of interest.
ACKNOWLEDGEMENTS
Financial support for this work, provided by Hubei Province Science and Technology Innovation Team Projects (T200906) and Research on Design Technology of Spiral Shale Shaker (2013H0522), are gratefully acknowledged.