
RESEARCH ARTICLE
Production Analysis of Tight Sandstone Reservoir in Consideration of Stress-Sensitive Permeability
Yinghao Shen1, *, Xinyu Yang2, Yuelei Zhang3
Article Information

Identifiers and Pagination:
Year: 2017Volume: 10
First Page: 82
Last Page: 93
Publisher Id: TOPEJ-10-82
DOI: 10.2174/1874834101710010082
Article History:
Received Date: 22/08/2016Revision Received Date: 07/02/2017
Acceptance Date: 10/03/2017
Electronic publication date: 28/04/2017
Collection year: 2017
open-access license: This is an open access article distributed under the terms of the Creative Commons Attribution 4.0 International Public License (CC-BY 4.0), a copy of which is available at: https://creativecommons.org/licenses/by/4.0/legalcode. This license permits unrestricted use, distribution, and reproduction in any medium, provided the original author and source are credited.
Abstract
Background:
Tight sandstone reservoirs play an important role in the oil industry. The permeability of tight sandstone reservoir generally has stronger stress sensitivity than that of conventional reservoir because of the latter’s poor physical properties. However, the production analysis of tight sandstone reservoir did not fully considered the stress-sensitive permeability yet.
Objective:
This paper proposed a production analysis method considering the stress- sensitive permeability.
Method:
This paper firtstly investigated the stress sensitivity characteristics and the effect of stress-sensitive permeability on a tight reservoir. Decline-type curves that consider stress-sensitive permeability are then established, and a systematic analysis method was built for the production analysis to obtain the single-well controlled dynamic reserves and reservoir physical properties.
Results:
A field analysis was performed in combination with Block Yuan-284 of Changqing Oilfield. Results show that with the reduction of reservoir pressure, stress sensitivity leads to the decline in reservoir permeability and the increase in seepage resistance, thus reducing the actual single-well controlled reserve and radius.
Conclusion:
By utilizing the analysis method based on the decline curves, we can effectively predict the single-well controlled dynamic reserves of such reservoirs and evaluate the characteristic parameters of reservoirs.
1. INTRODUCTION
Unconventional oil and gas resources have become an important aspect of current oil and gas production [1, 2], and stress sensitivity is an important feature of unconventional oil and gas reservoirs, such as tight gas reservoir, tight oil reservoir, and shale gas [3-8]. These reservoirs have poor physical properties, and the effect of stress sensitivity is also relatively more significant. Production analysis using decline-type curves is efficient in obtaining single-well controlled reserve and reservoir physical properties. This method is more advanced than the volumetric method because of the strong heterogeneity, very complex pore structure, and certain particularity in the seepage mechanism of unconventional reservoir [9-13]. The accurate evaluation and prediction of dynamic reserves is the basis of making a reasonable development program, and it plays a vital role in the reasonable and efficient exploitation of unconventional oil and gas resources.
The current production analysis methods do not consider the effect of stress sensitivity, and thus their calculation results produce a large deviation. This article brings stress-sensitive permeability into decline-type curves to obtain a more accurate production analysis, including single-well controlled dynamic reserves, to make the calculation result correspond with the actual situation of reservoir, and to effectively guide the development of stress-sensitive oil–gas reservoirs.
2. STRESS SENSITIVITY CHARACTERISTICS OF TIGHT SANDSTONE RESERVOIR
Pore pressure reduces constantly in the production of oil and gas, and thus effective stress increases accordingly. The corresponding relation is expressed in the following equation [14]:
 |
(1) |
where S is the total stress, σ is the effective stress (matrix stress and pressure between particles), a is the stress sensitivity correction coefficient, and is the fluid pressure or pore pressure.
Formula 1 shows that under the condition of unchanged total stress, the change in fluid pressure leads to the change in effective stress, which will correspondingly result in the change in rock physical property.
A permeability stress sensitivity experiment was conducted for the ultra-low permeability sandstone from Block Yuan-284 of Changqing Oilfield. The core belongs to the Triassic Chang-6 Reservoir Group of Ordos Basin. The main fragment component of the sandstone is feldspar lithic sandstone, which is fine-medium grain and very fine-fine grain. The stress sensitivity characteristics of sandstone were analyzed in the research area. The confining pressure was maintained, and the displacement pressure was changed to simulate the process in which the formation rock was compressed during exploitation. The stress sensitivity experiment was conducted using eight cores. Fig. (1) presents the curves of k/ki changing with pore pressure, where k/ki is the ratio of permeability and initial permeability under different pore pressure states. Fig. (1) also illustrates the experiment results. We can fit the results with the exponential law curves in which the fitting compliance degrees are all above 0.9.
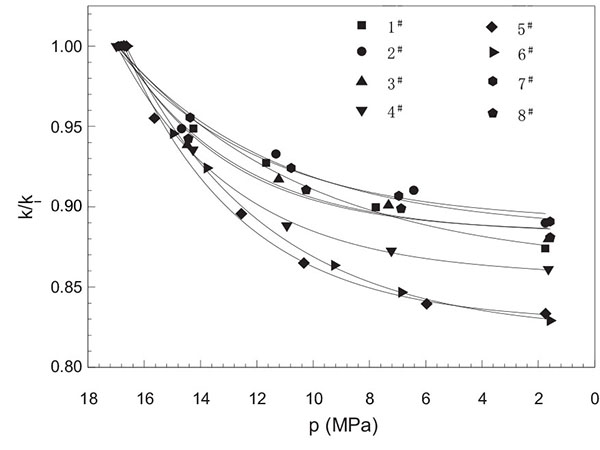 |
Fig. (1). Permeability stress-sensitive experiment results for chang-6 tight sandstones. |
3. TYPICAL DECLINE CHART CONSIDERING STRESS-SENSITIVITY OF PERMEABILITY
Blasingame’s decline-type curve [15, 16] is an important method developed on the basis of Fetkovich’s decline-type curve [17-19] for production data analysis to evaluate single-well controlled dynamic reserves and reservoir parameters. However, to the best of our knowledge, this method currently does not consider the effect of stress sensitivity. In this study, we established a physical and mathematical model that considers stress-sensitive permeability to obtain a new series of decline-type curves that allow fr the stress-sensitivity of permeability.
Assuming the presence of a vertical well with a circular reservoir (Fig. 2), the formation and the fluid satisfy the following conditions:
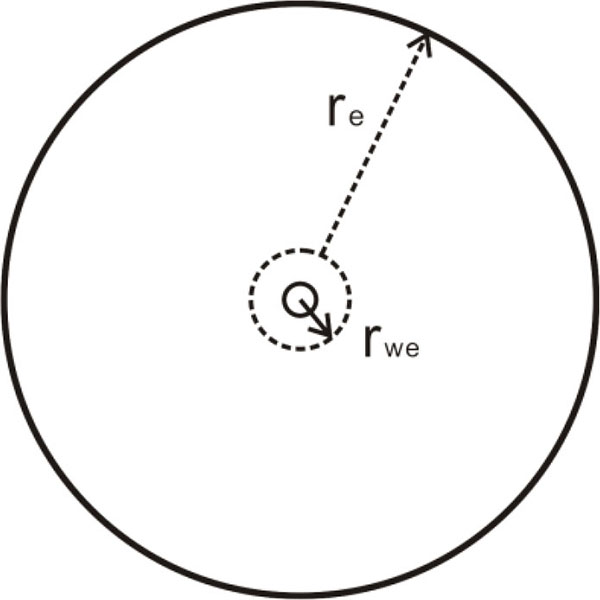 |
Fig. (2). Schematic Diagram of a Vertical Well in a Circular Closed Formation. |
- The reservoir is homogeneous and has a uniform thickness of h.
- The original formation pressure is Pi.
- The oil well runs throughout the whole reservoir with a wellbore radius of rw and constant production rate q.
- The outer boundary of the reservoir is closed, and the radius of the outer boundary is re.
- Permeability presents an exponential change law with pore pressure.
- The formation fluid is Newtonian fluid.
- The effect of capillary force, temperature, and gravity is ignored.
The basic flow equation of a homogeneous reservoir is
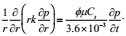 |
(2) |
When the permeability’s change in pressure follows an exponential law, the permeability modulus is effective in characterizing the permeability variation law. The relation of permeability change with effective stress can be expressed as follows [20]:
 |
(3) |
where γ is the permeability modulus of 1 MPa.
The integral for Equation (3) is
 |
(4) |
where ki is the reservoir permeability under the original formation pressure, mD.
Equation (4) is the expression of the exponential change law of permeability with pressure.
By bringing (4) into (2), we obtain the following eq:
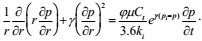 |
(5) |
The above formula is the basic percolation differential equation of a tight sandstone reservoir that considers the stress-sensitive effect of permeability. The following dimensionless variables are introduced:
 |
(6) |
 |
(7) |
 |
(8) |
The following dimensionless permeability modulus is defined as:
 |
(9) |
According to flow mechanics theory, the mathematical model of a homogeneous closed reservoir that considers stress sensitivity can be established.
The flow control equation is:
 |
(10) |
The initial conditions are expressed as:
 |
(11) |
The internal boundary are expressed as:
 |
(12) |
 |
(13) |
The external boundary conditions are expressed as:
 |
(14) |
To calculate the above model, we used the perturbation technique for calculation and introduced the transformation relation as follows:
 |
(15) |
The following perturbation techniques are applied as follows:
 |
(16) |
 |
(17) |
 |
(18) |
 |
(19) |
Given the small dimensionless permeability modulus, the zero-order perturbation solution is used. Thus, Equations (10–14) are expressed as follows:
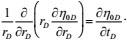 |
(20) |
| ηOD(rD,0) = 0 | (21) |
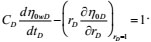 |
(22) |
 |
(23) |
 |
(24) |
By conducting the Laplace transform for Equation (20), its Laplace spatial solution can be obtainedas:
 |
(25) |
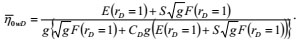
 |
(26) |
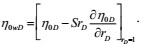
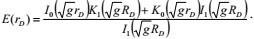
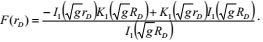 |
(27) |
In the above functions, KO and K1 are a zero-order and a first-order modified Bessel function, respectively, g is the Laplace Variable, L-1 is the Laplace inverse transform, and O(γD), ηwD is the allowance above zero-order solution.
By transforming the above analytical solution into a real spatial solution through the Stehfest inversion algorithm, we obtained PwD~tD. A typical decline-type curve mainly includes the decline-type curve dimensionless production proposed by Fetkovich, qDd, the dimensionless material balance time tDd proposed by Blasingame, and the dimensionless production integral and its derivative proposed by McCray, qDdi and qDid.
The decline-type curve dimensionless production and time are defined as follows:
 |
(28) |
 |
(29) |
Here, rwe=rw·e-s.
The auxiliary drawing function generally includes the dimensionless production integral and its derivative proposed by McCray. It is introduced for practical application and is conducive to improving the efficiency and accuracy of field engineers to explain and analyze production data. In actual use, the method of fitting three groups of data simultaneously is generally adopted to obtain the best fitting effect.
The following is the dimensionless production integral:
 |
(30) |
The following is the dimensionless production integral derivative:
 |
(31) |
By drawing qDd tDd, qDdi tDd and qDdid tDd on the log-log plot, decline-type curves for vertical wells in homogeneous reservoirs of stress-sensitive reservoir are formed.
Fig. (3) presents the decline-type curve under different dimensionless permeability moduli γD when the dimensionless reservoir radius reD is 5000, and the values of γD are 0, 0.0015, 0.003, and 0.0045 respectively. The difference between curves in the unsteady stage in the figure is small, and it is mainly in the pseudo steady stage. The curves are shown when γD is 0, 0.0015, 0.003, and 0.0045 from right to left.
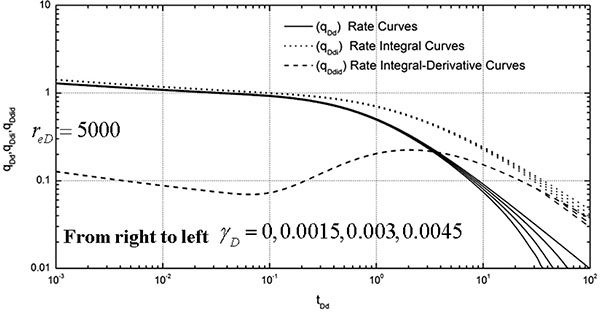 |
Fig. (3). Decline-type Curves for Vertical Wells in Stress-sensitive Reservoirs (Different Permeability Moduli). |
Fig. (4) illustrates the decline-type curves under different dimensionless reservoir radii reD when the dimensionless permeability modulus γD is 0.003 and the values of reD are 200, 500, 2000, and 5000, respectively. The difference exists both in the unsteady stage and in the quasi-steady stage. The curves are shown when reD is 200, 500, 2000, and 5000 from top to bottom.
Figs. (3) and (4) summarize the following basic laws of the decline-type curves for vertical wells in stress-sensitive reservoirs:
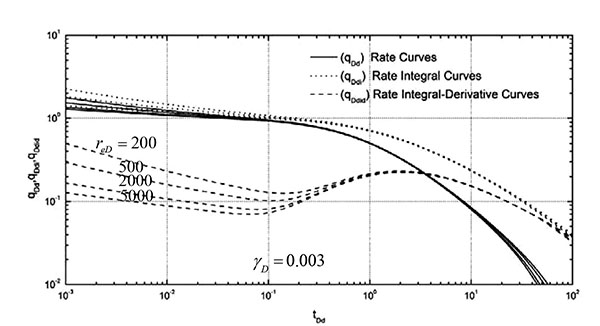 |
Fig. (4). Decline-type Curves for Vertical Wells in Stress-sensitive Reservoirs (Different Reservoir Radii). |
- Stress-sensitive permeability affects the decline-type curves, mainly those existing in the pseudo steady stage.
- Stress-sensitive permeability not only affects the production curve patterns but also the production integral and production integral derivative curve to a certain extent.
- After the curve reaches the pseudo steady state when stress sensitivity occurs, the production curve slope of the pseudo steady state for the conventional reservoir does not follow -1 any longer. The permeability is reduced because of the effect of stress sensitivity, and thus production decreases within the scope of discussion time.
- Under the same reservoir radius, the lowering degree of the curve increases with the increase in permeability modulus. Therefore, when other conditions are the same, the effect on production and the declining range of production becomes greater with the increase in stress-sensitive degree.
- Under the same dimensionless permeability modulus, the larger the dimensionless radius of the reservoir is, the greater is the lowering degree. That is, the effective transformation of the near-well-bore area can reduce the effect of stress sensitivity on the production.
4. INSTANCE ANALYSIS
An instance analysis was conducted by selecting a well in Block Yuan 284 that belongs to Ordos Basin. Block Yuan 284’s purpose of horizon is the Chang-6 formation. The effective thickness of this well was 10.94 m, with porosity being 0.13, irreducible water saturation being 43%, and well radius being 0.1 m. Its production history is illustrated in Fig. (5). The history of this well was studied first. No other operation measures wereadopted after the fracturing production of this well. Its production and pressure data were monitored daily that are representative of relatively high accuracy and good correlation (Fig. 5). The water injection enhancement productivity effect was poor, pressure and production declined with time, and the oil well remained at the depletion development state.
This well does not undergo unstable pressure testing after being put into production. Therefore, we mainly used its production data to judge the model as shown in Fig. (6).
The basic model characteristics are as follows:
- Pseudo-steady characteristicsare observed . The tightness of reservoir leads to poor flowability and a very slow effect of the water injection well. The dynamic response characteristics indicate that this well does not take effect, and thus the oil well gradually achieves the quasi-steady state with no peripheral pressure response characteristics.
- Hydraulic fracture characteristicshave been observed . The flow characteristics of the non-steady stage do not conform to the characteristics of the hydraulic fractured well. Although fracturing production is made for this well, the role of fractures in this well is to improve the near-well-bore permeability because of poor reservoir permeability. The physical property of the reservoir periphery is relatively poor, and it is a common feature of this well area that can be observed from the unstable pressure testing curve of similar wells in this well area.
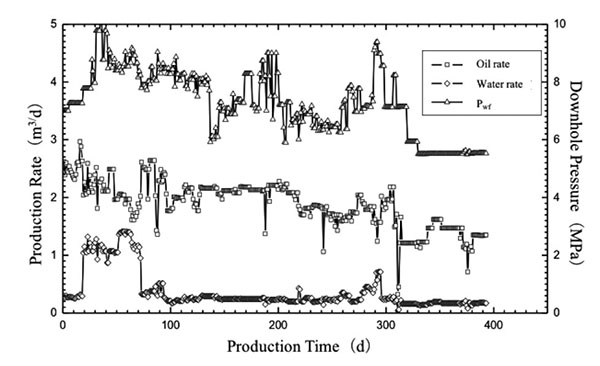 |
Fig. (5). Production History of the Target Well. |
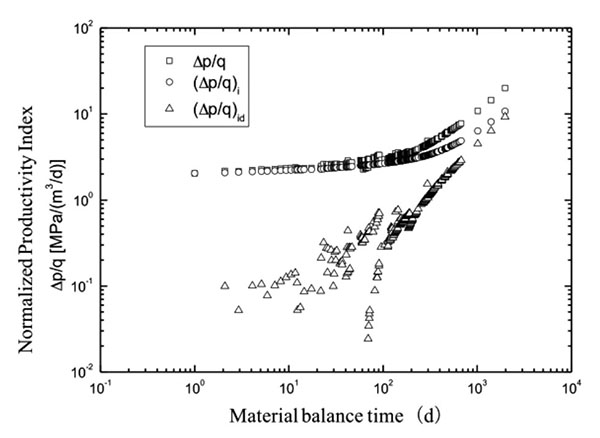 |
Fig. (6). Curves for the Normalized Productivity Index Function vs. Material Balance Time. |
To sum up, the basic model of this well is a vertical well within a stress-sensitive closed reservoir. This well can be the model of a vertical well within a stress-sensitive closed reservoir. Through the exponential curve fitting, we obtained its permeability modulus of 0.0097 (1/MPa). The dimensionless permeability modulus of 0.0031 was calculated by Equation (7), to select a reasonable decline chart series from it.
To calculate the material balance time, the material balance time of the oil well is defined as follows:
 |
(32) |
The calculated normalized production, production integral, and its derivative are defined as follows:
Normalized production
 |
(33) |
Production integral (defined as the average production of well at a certain time)
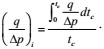 |
(34) |
Production integral derivative
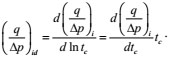 |
(35) |
A log-log plot was drawn for the curve of three production functions versus material balance time, with its coordinate scale, the same as that of the typical decline chart, and a typical decline chart with γD equal to 0.003 was used. Through fitting, the production curve can be better fitted with a typical decline-type curve with a dimensionless reservoir radius reD equal to 200 (Fig. 7).
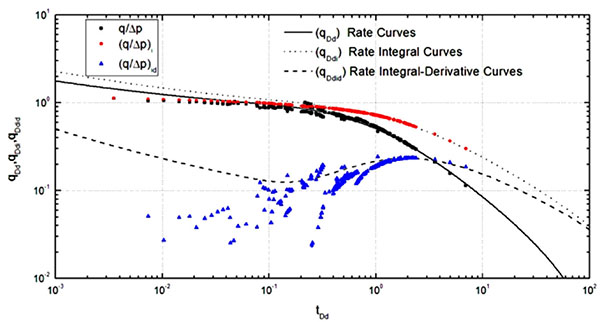 |
Fig. (7). Fitting Curve of the Typical Decline-type Chart. |
The following fitting parameters can be obtained through fitting:
reD=200
(tDd)MP=1.0, (tc)MP=6000(h)
(qDd)MP=1.0, (qO/  p)MP=0.38(m3/ (dMPa))
The typical curve analysis and calculation result are as follows:
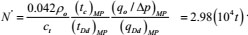
Single-well controlled dynamic reserves
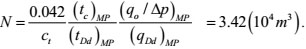 |
(36) |
Single-well controlled dynamic reserves expressed by quality
 |
(37) |
Reservoir discharge area
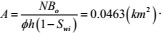 |
(38) |
Equivalent control radius
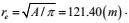 |
(39) |
Original effective permeability
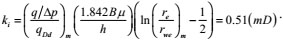 |
(40) |
Skin coefficient
| s = -ln[(re /reD)/ rw] = -2.01. | (41) |
After the model and the parameters were determined, the production history was required to be fit to verify the correctness of the model and the parameters. The well is a vertical well model within a stress-sensitive closed reservoir, and the basic parameters for fitting have been determined through the chart. The history fitting curve is presented in Fig. (8).
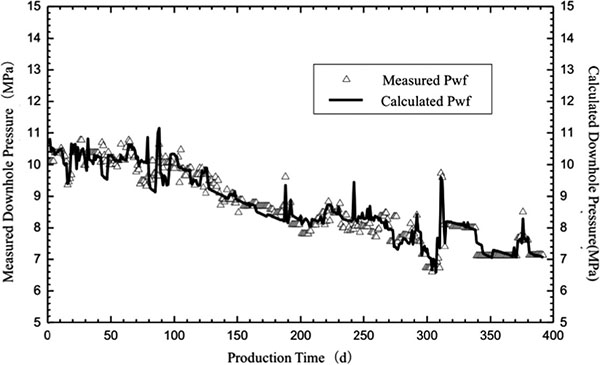 |
Fig. (8). Production History Fitting Curve. |
Fig. (8) indicates that the fitting degree is high, and thus the adopted model and parameters have high credibility and can correctly reflect the actual status of the oil well.
CONCLUSION
- The permeability of Chang-6 tight sandstone in Block Yuan-284 of Changqing Oilfield had significant stress sensitivity characteristics, and thus stress-sensitive permeability needed to be considered in the analysis of reservoir engineering to improve the accuracy and reliability of analysis.
- This article introduced the stress sensitivity of permeability, established the seepage control equation in consideration of stress-sensitive permeability, and calculated it. Thus, the typical decline chart under stress sensitivity was obtained.
- The typical decline chart indicated that stress sensitivity decreased the actual single-well controlled dynamic reserves and the single-well controlled radius. The reason for this phenomenon is that, with the reduction of reservoir pressure, stress sensitivity leads to the lowering of reservoir permeability and the increase in seepage resistance.
- An sample application was performed according to the established typical decline chart in consideration of the stress sensitivity of permeability and in combination with a certain well in Block Yuan 284 of Changqing Oilfield. The analysis method based on this chart can effectively predict the dynamic reserves and evaluate the characteristic parameters of the reservoirs.
CONFLICT OF INTEREST
The authors confirm that this article content has no conflict of interest.
ACKNOWLEDGMENTS
This work is supported by the National Natural Science Foundation of China (Grant No. 51604287, 51490652).