
RESEARCH ARTICLE
Corrosion Behavior of 3% Cr Casing Steel in CO2-Containing Environment: A Case Study
Lin Xu1, 3, Jie Xu2, Ming-biao Xu3, *, Si-yang Li4, Shuai Liu4, Yue Huang3, Fu-chang You5
Article Information

Identifiers and Pagination:
Year: 2018Volume: 11
First Page: 1
Last Page: 13
Publisher Id: TOPEJ-11-1
DOI: 10.2174/1874834101811010001
Article History:
Received Date: 23/11/2017Revision Received Date: 18/12/2017
Acceptance Date: 08/02/2018
Electronic publication date: 28/02/2018
Collection year: 2018
open-access license: This is an open access article distributed under the terms of the Creative Commons Attribution 4.0 International Public License (CC-BY 4.0), a copy of which is available at: https://creativecommons.org/licenses/by/4.0/legalcode. This license permits unrestricted use, distribution, and reproduction in any medium, provided the original author and source are credited.
Abstract
Introduction:
The production casing of 3% Cr steel has encountered severe internal corrosion in Huizhou Oilfield. To disclose corrosion behavior of inner casing, a series of corrosion exposure tests were systematically conducted on 3% Cr coupons in terms of in-field conditions.
Material and Methods:
Influence of exposure time, temperature, and water-cut on the CO2 corrosion of 3% Cr steel was investigated, and analyses on weight loss, composition and morphology of corrosion product, and Tafel polarization curves were further carried out.
Result:
The results showed that the corrosion rate of 3% Cr steel increased with increasing temperature, but such trend descended when the temperature exceeded 65°C due to formation of an compact and adherent corrosion product film on the surface of 3% Cr coupons. While varying exposure time from 7 days to 14 days, the corrosion rate decreased, and the Cr and O enrichment was determined in the corrosion products. The corrosion rate of 3% Cr steel increased with a continuous increment of water-cuts, especially when the water-cut was larger than 40%.
Conclusion:
The localized corrosion can happen at the lower water-cut due to the presence of amorphous films. The main corrosion products were FeCO3, Cr5O12, Fe2O3, and Fe-Cr. Entry of CO2 to the simulated formation water caused an increase in the anodic Tafel slope, and accelerated dissolution of 3% Cr steel.
1. INTRODUCTION
The sweet corrosion of metals caused by wet CO2 gas has attracted extensive attention over recent years. In the production of oil and gas, CO2 is usually found as a kind of associated gas or gas flooding source, and leads to a lot of internal corrosion accidents such as tubing failure, equipment damage and pipeline leakage. Therefore, CO2 corrosion has been widely investigated and some efforts have already been made to retard CO2 corrosion.
CO2 corrosion mechanism was well defined and the prediction models was developed [1-4]. Influence of corrosion products on corrosion forms (i.e., general corrosion and localized corrosion) was widely explored [5-7]. It was found that the main corrosion product, iron carbonate (FeCO3), formed on the surface of metal can behave as a protective film to hinder CO2 corrosion; while another product of iron carbide (Fe3C) can accelerate the localized corrosion by the galvanic reaction. These previous studies demonstrate the nature of sweet corrosion and provide important information on anti-corrosion technologies.
At present, utilization of CO2 corrosion resistant metal is the most important approach in sweet environments. In particular, Cr bearing steel is already employed as the casing material instead of carbon steels, due to the strong CO2 corrosion resistance and high cost effectiveness. Cr bearing (1~5%) steels were observed to enhance resistance to CO2 corrosion by a factor of at least 3 and even up to 10 times, whilst maintaining a cost penalty less than 1.5 times than that of the conventional grades of carbon steels [8, 9]. Therefore, low Cr bearing steels have been developed as an intermediate corrosion resistance alloy between carbon steels and API L80-13Cr steels.
Despite extensive investigation on CO2 corrosion process of low Cr steels, the common results appear to be very limited in the unique CO2 corrosion environments. When the corrosion conditions are variant, intrinsic characteristics of low Cr steels upon corrosion would change. In Huizhou oilfield, severe corrosion damage of 3% Cr casings has been detected. As compared to various repairing operation on-site, however, less attention has been paid to understand corrosion behavior of casing. In particular, there is a lack of reliable physicochemical data of corrosion process and little understanding of the mechanism of CO2 corrosion in the aggressive downhole conditions. Thus a case study directly linked to the in-field corrosion conditions will be necessary to determine CO2 corrosion characteristics. CO2 corrosion process of low Cr steels needs to be explored in combination with certain environments, which would also prompt effective implemention of anticorrosion strategy.
To shed more light on the corrosion damage, status of casing corrosion encountered in Huizhou oilfield is further illustrated below.
1.1. Well Corrosion Status
In Huizhou oilfield, the aggressive downhole environment involving high temperature (up to 105°C), high salinity of formation water, and sweet CO2 gas has been determined. 3% Cr steel is the material of 9-5/8” production casing, and has been encountering serious CO2 corrosion damage because of its overdue service. Fig. (1) shows the corrosion damage of 9-5/8” and 13-3/8”casings. Comparison of corrosion status of 9-5/8” and 13-3/8”casings indicates that corrosion damage of 9-5/8” casing is more severe than that of 13-3/8”casing. A deeper and larger crack can be found in 9-5/8” casings, suggesting its failure as well as barriers. The stronger corrosion damage in 9-5/8” casing can be attributed to the direct exposure in the corrosive media. Once 9-5/8” casing fails to seal the corrosive media, it would be inevitable that corrosion damage can further extend to 13-3/8” intermediate casing or even to 20” riser. As a matter of fact, there are over 14 production wells that have encountered severe internal corrosion in all 92 wells so far.
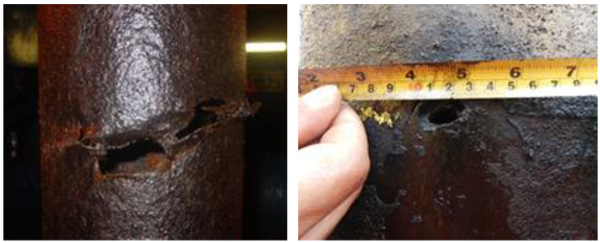 |
Fig. (1). Corrosion crack and pit in 9-5/8” casing(left) and 13-3/8”casing(Right). |
Internal corrosion of casings is usually contacted with water-cut in the stage of oil and gas production. In principle, the longer the service time of production wells, the higher water-cut, and consequently the larger the risk of internal corrosion. Taking into account corrosion environments, two corrosion routes can be determined, as shown in Fig. (2). The internal corrosion of casing and tubing materials arises from the wet CO2 gas, and external corrosion of riser can result from the corrosive ocean environments (e.g., splash and tide zones). These two corrosion routes can cooperatively accentuate the well integrity and dramatically shorten the service time of production wells.
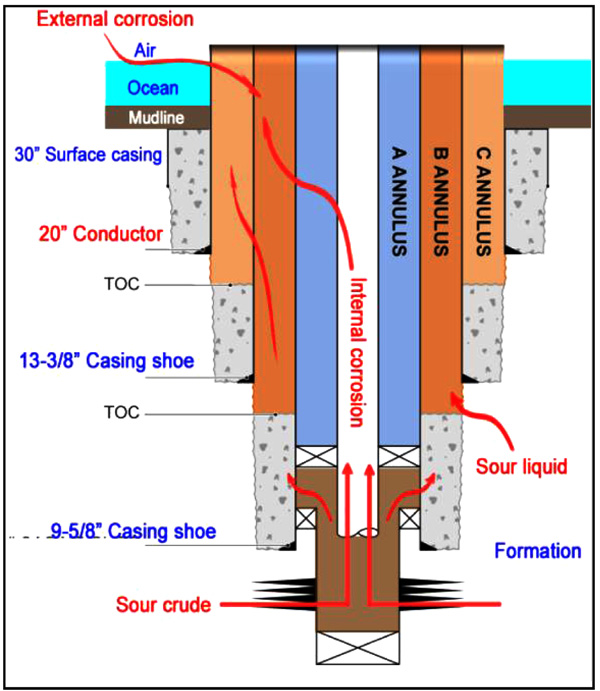 |
Fig. (2). Schematic illustration of corrosion form in offshore product wells. |
In the present work, a series of corrosion immersion tests was conducted on 3% Cr steel that has the same composition with the production casing in Huizhou oilfield. To clarify CO2 corrosion behavior of 3% Cr on-site, the influence of corrosion conditions such as corrosion temperature, exposure time and water-cut has been investigated by analyzing corrosion rate, product morphology and composition, as well as electrochemical polarization curve. Such paper should be meaningful to not only unveil CO2 corrosion feature of 3% Cr casing, but also give a clue to define the detailed strategy against CO2 corrosion in Huizhou oilfield.
2. EXPERIMENTAL PROCEDURE
2.1. Weight Loss Method
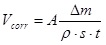
Weight loss measurements are widely used to examine corrosion rates in the presence of corrosive medium. Such method can not only provide key data on weight loss, but also offer distribution and form of corrosion occurred in the metal surface. It is a simple matter to convert the weight loss measurements into average depths of penetration. Uniform corrosion rate is calculated by the Eq 1:
 |
(1) |
wherein A denotes unit conversion factor, Δm is the weight loss(g), ρ is the material density(kg/m3), s is the surface area(cm2), and t is the corrosion time(h). When A is 8.76×10⁷, unit of corrosion rate is millimeter per year(mm/a).
2.2. Dynamic Corrosion Cell
Dynamic corrosion experiments were carried out in a special Hastelloy c276 autoclave (Fig. 3), which is confirmed to be strongly corrosion-resistant to wet CO2 gas. The testing compartment consists of a vertically positioned cell with an inner diameter of 85 mm and a volume of 1 litre. The autoclave has a thermostatically controlled heating system and temperature can be designed up to 250°C; the testing pressure can be adjusted (up to 10MPa) by the compressed gas cylinder. A magnetic stirrer with the coupon holder was equipped at the end of the shaft, to simulate the relative flow of the medium at the designed speed, through which the maximum of 700 rpm can be attained.
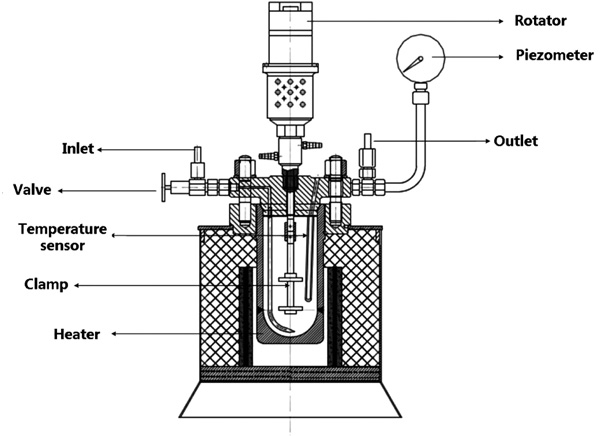 |
Fig. (3). The structure of autoclave designed for dynamic corrosion tests. |
2.3. Corrosion Materials
The testing coupons were made up of 3% Cr derived from the same piece of 9-5/8” casing in Huizhou oilfield. All of the coupons were in the size of 50mm×10mm×2mm. The chemical composition of 3% Cr steel investigated is shown in Table 1.
| Specimen | C | Si | Mn | P | S | Cr | Mo | Ni |
|---|---|---|---|---|---|---|---|---|
| 3% Cr | 0.22 | 0.29 | 0.5 | 0.015 | 0.005 | 2.94 | 0.3 | 0.1~0.5 |
The formation water with a high salinity was determined to be CaCl2-type. The main components and their concentrations of the corrosive solution simulating the formation water are listed in Table 2.
| Salts | NaCl | MgCl2 | CaCl2 | KBr | KCl | SrCl2 |
|---|---|---|---|---|---|---|
| Amount(wt.%) | 14.5 | 0.6 | 3.3 | 0.09 | 0.14 | 0.1 |
2.4. Test Matrix
All 3% Cr coupons were treated in terms of NACE Standard RP0775-2005. During the course of corrosion immersion tests, the pure N2 was firstly bubbled into the simulated formation water for 0.5h to deoxygenate. The stirring rate was controlled at 200rpm to simulate the flow of production fluid, and the CO2 pressure was controlled at 0.2MPa in terms of the bubble point.
Table 3 presents the experimental conditions of each test. To disclose 3% Cr corrosion behavior in more details, some weight loss tests were designed and conducted in terms of in-field conditions: (1) influence of the downhole temperature, (2) influence of the exposure time and (3) the influence of water-cut of crude oil.
The corrosion rate was firstly measured using the weight loss method. Corroded coupons are an excellent source of corrosion information and are also subjected to visual and microscopic examination. Meanwhile, it is generally known that the formation of corrosion product film is closely associated with dynamic corrosion procedure of metals. Therefore, the morphology, microstructure and composition of the corrosion product films were investigated by Scanning Electron Microscopy (SEM), Energy dispersive X-ray Spectroscopy (EDS) and X-ray Diffraction (XRD).
After physics-based inspection method, the Potentiodynamic Sweep (PS) technique was applied, which is often referred to as an intelligent weight loss tests. Herein, PS measurement was conducted by a sweep starting -400mv and finishing-1000mv over the open circuit potential with a scan rate of 4mv/s to obtain both the cathodic and anodic characteristics. Finally, tafel polarization curves of 3% Cr steel exposed in the simulated formation water saturated with and without CO2 were obtained using CHI 630E.
| No. | Specimen Materials | Temp. (°C) |
Exposed Time (day) |
Water-Cut (wt.%) |
|---|---|---|---|---|
| 1 | 3% Cr | 45 | 7 | 100 |
| 2 | 3% Cr | 65 | 7 | 100 |
| 3 | 3% Cr | 85 | 7 | 100 |
| 4 | 3% Cr | 105 | 7 | 100 |
| 5 | 3% Cr | 85 | 14 | 100 |
| 6 | 3% Cr | 85 | 7 | 20 |
| 7 | 3% Cr | 85 | 7 | 40 |
| 8 | 3% Cr | 85 | 7 | 70 |
3. RESULTS AND DISCUSSION
3.1. Influence of Corrosion Temperatures
Considering the reservoir temperature up to 105°C, corrosion immersion tests of 3% Cr were separately conducted at 45°C, 65°C, 85°C, and 105°C, to disclose influence of temperature on CO2 corrosion of 3% Cr. The relation between corrosion rate and temperature(T) is given in Fig. (4).
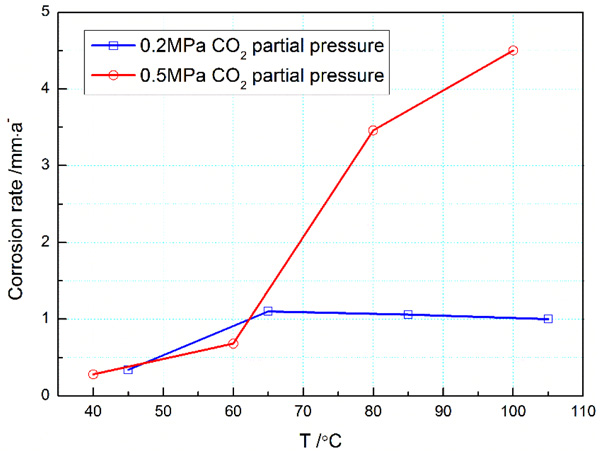 |
Fig. (4). Effect of temperature on corrosion rate of 3 % Cr steel in the CO2 environments. Corrosion data of 0.5Mpa CO2 partial pressure were reproduced with permission from Ref [10]. copyright 2011 NACE International. |
It can be found in Fig. (4) that as the temperature increases, the corrosion rate firstly increases and then becomes steady. At the first stage, the corrosion rate gradually ascends with temperature and arrives up to the maximum of 1.14mm/a at 65°C. The corrosion rate increases by about 156.4% than that tested at 45°C. From chemical dynamic point of view, increasing temperature can facilitate ion motion, and the dissolution of metal bulk should be stronger than precipitation of corrosion product. Therefore, CO2 corrosion of 3% Cr steel becomes more severe with temperature. Further, the corrosion product can gradually precipitate on the surface of coupons with increasing temperature, and a tight protective film can be formed against CO2 corrosion. As a result of product precipitation, the transfer of substance from 3% Cr bulk to CO2 corrosive media becomes partially retarded and, in this case, the corrosion rate is sustained to be about 1.0mm/a until 105°C. It is clear that CO2 corrosion will retards at high temperature. This trend has been validated by previous studies [10, 11].
To disclose CO2 corrosion behavior of 3% Cr with temperature in more details, CO2 corrosion data derived from Ref [10]. were comparatively introduced, as schematically shown in Fig. (4). It can be readily observed that at 0.5MPa, the corrosion rate of 3% Cr coupon, as anticipated, increased with temperature and then reached the maximum of 4.5mm/a at 100°C, increasing by 1,700% relative to that examined at 40°C. Moreover, one can find that the ascending trend of corrosion rate reduced when the temperature exceeded 80°C, indicative of the formation of protective film composed of FeCO3 and Cr2O3 on the metal surface. Undoubtedly, this alteration of corrosion rate with temperature is in agreement with results obtained at 0.2MPa. As compared to the change of corrosion data at 0.2MPa, however, the decline trend of corrosion rate was observed to be weaker at 0.5MPa, which can be ascribed to the larger CO2 partial pressure. In principle, the larger the CO2 partial pressure, the more severe the metal corrosion.
To shed more light on the corrosion behavior of 3% Cr steel, SEM and EDS methods have been used to examine the microstructure of corrosion products formed on the surface of samples. These two methods have been extensively utilized to explore the corrosion mechanism.
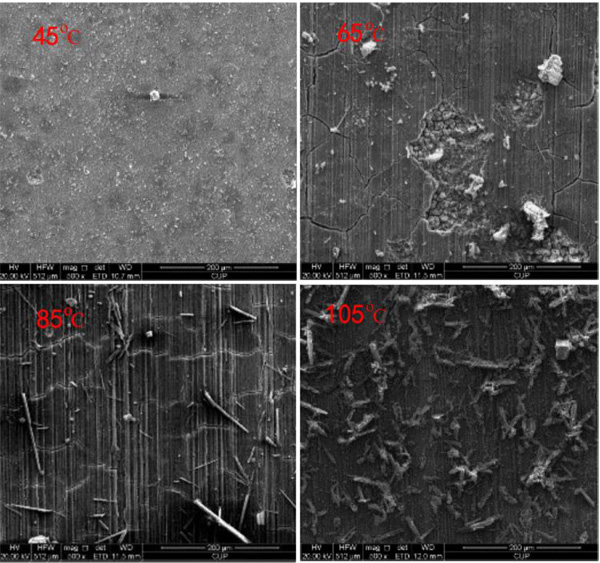 |
Fig. (5). SEM morphology of corrosion product layers of 3% Cr formed at different temperatures. |
Fig. (5) presents the SEM morphology of corrosion product films formed at the considered temperatures in certain CO2 environment. It is clear that in Fig. (5), the corrosive production film displays different morphology with increasing temperature. For example, corrosion products were granular at 45°C, being incapable of entirely covering the surface of 3% Cr coupon. At 65°C, the film appeared to be poorly adherent and even part of film broke up, suggesting the stronger corrosion action. When the temperature rised up to 85°C, a compact and tight film was observed on the surface of 3% Cr coupon, rationalizing a decline in the corrosion rate. At 105°C, the extra precipitation can be found on the surface of film and, in this case, the CO2 corrosion can be attenuated due to an existence of protective film. Apparently, the morphology of product film with temperature can validate the variation of corrosion rate vs. temperature offered in Fig. (4).
Fig. (6) further shows the EDS analysis of corrosion product formed at the considered temperatures. The main elements of corrosion product film of 3% Cr steel are Cr, Fe, and O, wherein the content of Fe tends to decline with increasing temperature. For example, the signals of Fe at 45°C, 65°C, 85°C, and 105°C were 266 Kcnt/cps, 248 Kcnt/cps, 201 Kcnt/cps, and 57 Kcnt/cps, respectively. This finding shows that with precipitation of the corrosion product on the surface of 3% Cr steel, Cr was dominant in the protective film. As previously pointed out by Xu [12], the increased enrichment of Cr and O plays an important role in the growth of the corrosion product film, which can decrease the corrosion rate. This result also rationalizes the aforementioned relation between the corrosion rate and temperature.
 |
Fig. (6). EDS analysis of corrosion product layers of 3% Cr steels corroded at the investigated temperatures. |
Inspection of Figs. (5 and 6) establishes that while varying the temperature from 45°C to 105°C, a protective film can form on the surface of 3% Cr coupons, and Cr and O enrichment of film composition greatly contribute to corrosion resistance of 3% Cr in CO2 environments. Besides, no apparent localized corrosion was found on the surface of all the samples.
3.2. Influence of Exposure Time
To understand continuous corrosion behavior of casing, weight loss tests were further conducted on 3% Cr coupons at 85°C for 7 and 14 days in the simulated formation water. Corrosion rates of 3% Cr samples corroded for 7 days and 14 days were observed to be equal to 1.05mm/a and 0.86mm/a, respectively. The corrosion rate reduced by 18% when varying exposure time from 7 days to 14 days.
Fig. (7) shows the SEM morphology and EDS analysis of corrosion product layers formed on the surface of 3% Cr steel. The formed product films were both compact and continuous, especially when the exposure time was 14 days. Meanwhile, the cracks could be observed in the films, which could be resulted from the dehydration of the corrosion product layers. Herein, it was worth noticing that a lot of granular precipitation covered the surface of product film corroded after 14 days.
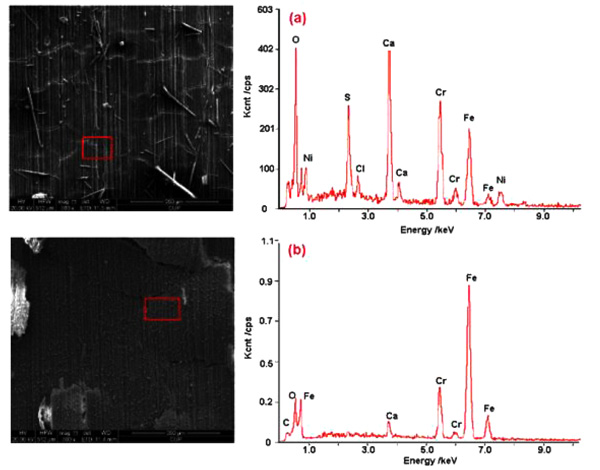 |
Fig. (7). SEM morphology and EDS analysis of corrosion product layers of 3% Cr exposed in certain corrosive environment after (a) 7 days and (b) 14 days. |
Furthermore, the EDS analysis indicates that these corrosion products contain mainly Cr, Fe, Ca, and O. The Cr content in the corrosion film formed after 14 days was higher than that formed after 7 days, displaying enrichment of Cr element in the former film. Apparently, the Cr enrichment can largely facilitate the formation of protective corrosion film. In addition, the Fe content was found to increase with exposure time, which can be ascribed to the formation of iron carbonate (FeCO3). Also, this observation gives an explanation of granular precipitation formed on the film surface mentioned above.
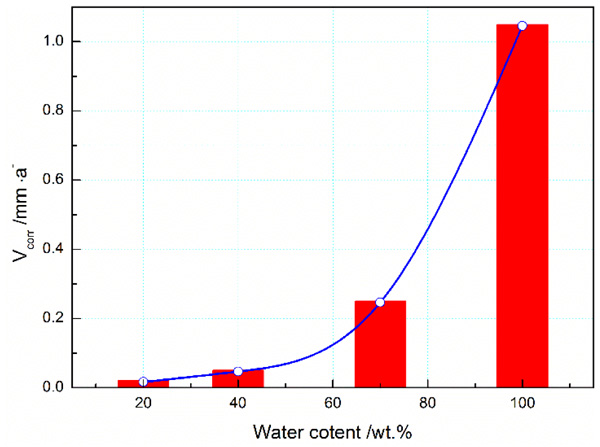 |
Fig. (8). Effect of water-cut on corrosion rate(Vcorr) of 3% Cr in the CO2 environment. |
3.3. Influence of Water-Cuts
The water content of crude oil, termed as water-cut, has an important impact on corrosion process of casing steels in the long-term production. Here, the effect of water-cut on CO2 corrosion of 3% Cr was investigated. Fig. (8) presents the change in corrosion rate of 3% Cr in the CO2 environment with variation of water-cut in the range from 20% to 100%.
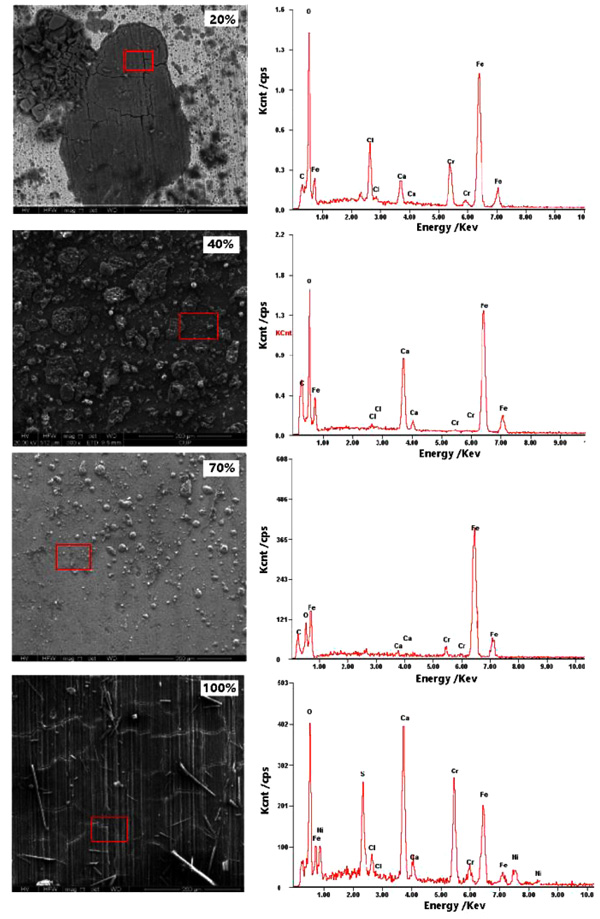 |
Fig. (9). SEM morphology and EDS analysis of corrosion product layers of 3% Cr formed at different water-cuts. |
In Fig. (8), one readily finds that corrosion of 3% Cr becomes more severe with increase of water-cuts. When the water-cut varied from 20% to 100%, the corrosion rate increased from 0.02 mm/a to 1.04mm/a, increasing by around 52 times lower than the latter. Undoubtedly, crude oil had partial protection to 3% Cr steel in the considered media. On the other hand, a dramatic rise was observed as the water-cut increased from 40% to 70%. Considering the susceptibility of 3% Cr corrosion to water-cut in the sweet environments, together with the requirements of injection inspection [13], the anticorrosion strategy was proposed when the water-cut would exceed 40%, which should be effective to prolong the service life of casing.
Fig. (9) shows the SEM morphology and EDS analysis of corrosion product layers of 3% Cr formed at 20%, 40%, 70%, and 100% water-cuts. Comparing different SEM morphologies, one can observe that the corrosion product layer gradually formed on the surface of samples, which entirely covered 3% Cr steel at 100% water-cut. This finding corresponds well with the results of corrosion rates shown in Fig. (8). Besides, the corrosion product film showed to be more amorphous at low water-cut and, at this point, pitting corrosion is more likely happen. The EDS analysis shows that corrosion products mainly contain O, Fe, and Cr, wherein the contents of Cr and O decreased with an increment of water-cut. In principle, enrichment Cr and O in corrosion product films is a good indicator of corrosion resistance.
The XRD method has proved itself a valuable tool to determine chemical composition of materials. In the previous studies, the XRD approach has been effectively applied to systematically investigate corrosion mechanism of metals. Fig. (10) presents the chemical composition of corrosion product film formed at 100% water-cut. It is apparent in Fig. (10) that the chief compositions of corrosion product FeCO3, CaCl2, Cr5O12, Fe2O3, and Fe-Cr, in which Cr5O12 is a compound of Cr2O3 and CrO3 in nature. Conspicuously, the corrosion products, such as FeCO3 and Cr5O12, can partially passivate the corroding steel surface due to their limited solubility. Thus further corrosion can be avoided, and the CO2 corrosion of 3% Cr can be attenuated.
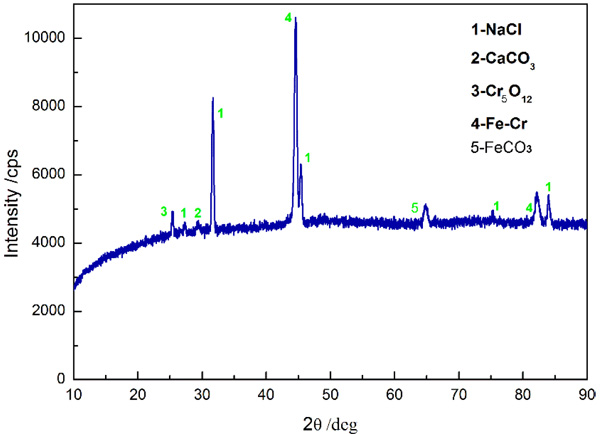 |
Fig. (10). XRD spectrums of 3% Cr steel exposed in 100% water-cut media after 7 days. |
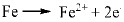
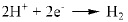
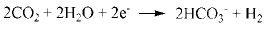
On the basis of analyses on the main compositions of corrosion product, the following chemical reactions were considered:
 |
(2) |
 |
(3) |
 |
(4) |
 |
(5) |
 |
(6) |
 |
(7) |
It was previously reported that in CO2 corrosion, the main corrosion reactions contain equation (2-5) [14], so the main composition of corrosion product is FeCO3. As for low Cr-containing metal, another kind of reaction will also take place, as described in equation (6) and (7). The composition Cr2O3 is generated from dehydration of Cr(OH)3, which contributes markedly to corrosion resistance of 3% Cr steel. Additionally, the cracks in the surface of the corrosion product film should be closely contacted with H-induced stress under the sweet condition.
3.4. Analysis on Tafel Polarization Curves
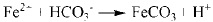
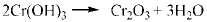
The PS method, as an important complement to physics-based inspection, can offer additional insight into the corrosion process. Fig. (11) illustrates the typical Tafel polarization curves for 3% Cr samples immersed in the simulated formation water saturated with and without CO2.
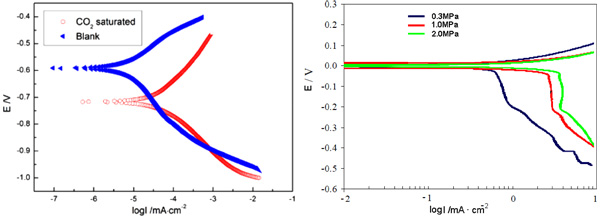 |
Fig. (11). Comparison of polarization curves for 3% Cr (left) and mild steel(right) at different CO2 partial pressures. Note that, polarization curves of mild steel was adapted with permission from Ref [17]. copyright 2004 NACE International. |
In Fig. (11), corrosion acceleration can be found in the sweet laboratory brine. The corrosion potentials of 3% Cr in the brine with or without CO2 were -0.59V and -0.72V, respectively. In principle, the lower the corrosion potential, the more easily the corrosion reaction will happen. Obviously, the corrosion of 3% Cr steel is more likely to occur in the sweet brine than in the pure brine. Additionally, the corrosion currents in the sweet brine saturated with and without CO2 were about 3.3×10⁻⁵ mA/cm2 and 7.1×10⁻⁶ mA/cm2, respectively, wherein the former is one order of magnitude larger than the latter, suggesting the stronger corrosion reaction in the sweet brine. In general, the anodic curve is closely associated with the metal corrosion reaction. Here, one can easily observe that in the anodic curve, the corrosion current appears to be larger in the CO2 saturated brine than that tested in the blank brine. For example, when the corrosion potential was of -0.5V, the corrosion currents examined in the CO2 saturated and blank brine were 6.3×10⁻⁴ mA/cm2 and 3.2×10⁻⁵mA/cm2, respectively. This fact reflects that in the sweet brine, 3% Cr steel is in a more active state and the metal dissolution reaction occurs more heavily. Factually, the previous study has confirmed such profile of Tafel polarization curve in the sweet media [15-17].
Moreover, additional analysis on the profiles of polarization curves given in the present work and in [17] was conducted, for a better understanding of the effect of CO2 on 3% Cr corrosion behavior. The results are shown in Fig. (11). As expected, the anodic curve of mild steel was shifted to higher current with an increment of CO2 partial pressure, which means stronger corrosion reaction at higher CO2 partial pressure. For instance, anodic currents measured at 0.3MPa and 2.0MPa were 0.3mA/cm2 and 0.7mA/cm2, respectively, when the corrosion potential was of 0.05V. Variation of corrosion currents should be attributed to the local formation of carbonic acid. It is evident that the profile of polarization curve of mild steel is consistent with that found in 3% Cr coupon. Not surprisingly, due to different corrosion-resistance and corrosive environments, 3% Cr and mild steel display a large difference in corrosion data. Nevertheless, it should be emphasized that this comparison was chiefly made to exactly reveal the similar anodic polarization between 3% Cr and mild steels in the CO2 environments.
These results reveal that CO2 can facilitate the corrosion of steels even with low Cr bearing. Hence, the corrosion resistance of 3% Cr steel probably declines in the aggressive sweet environments after a long-term service. As mentioned above, the anti-corrosion strategy should be effectively implemented in terms of water-cuts to enable sustainable production in Huizhou Oilfield.
CONCLUSION
In the present work, a series of corrosion exposure tests was conducted on 3% Cr steel, in combination to the downhole conditions of Huizhou oilfield, to explore corrosion behavior of inner casing caused by wet CO2. Analyses of corrosion rate, structure morphology, corrosion product composition, and Tafel polarization curve were further carried out. The main results obtained are summarized as follows:
- The corrosion rate of 3% Cr steel increased with increasing temperature, but this trend descended when the temperature exceeded 65°C, due to the formation of a compact and adherent corrosion product film on the surface of 3% Cr coupons.
- When increasing the exposure time, the corrosion rate of 3% steel decreased, and the Cr and O enrichment was determined in the corrosion products, which rationalized the formation of the protective film of chromium oxide.
- The corrosion rate of 3% Cr steel increased with an increment of water-cuts, especially when the water-cut was larger than 40% and, at this point, the anti-corrosion strategy was proposed to implement.
- The main corrosion products of 3% Cr steel were found to be FeCO3, Cr5O12, Fe2O3, and Fe-Cr, in which Cr5O12 can contribute to corrosion resistance of 3% Cr steel by forming the thin and tight film.
- CO2 caused a drastic change in the polarization behavior of 3% Cr steel. The anodic Tafel slope became larger in the sweet brine, indicating stronger dissolution of 3% Cr steel.
These results on 3% Cr steel corroded in the CO2 environments will not only partially elucidate the corrosion behavior of inner casing metal in Huizhou Oilfield, but can also complement the knowledge of sweet corrosion with respect to low Cr bearing steels.
CONSENT FOR PUBLICATION
Not applicable.
CONFLICT OF INTEREST
The authors declare no conflict of interest, financial or otherwise.
ACKNOWLEDGEMENTS
The authors thank the Scientific Research Foundation of ZJOU (No. Q1510), Public Application Research Foundation of Zhejiang Province (No. 2016C33032), and National Science and Technology Major Project (No. 2016ZX05060-015) for financial support.
REFERENCES
| [1] | Nesic S. Key issues related to modeling of internal corrosion of oil and gas pipelines-A review. Corros Sci 2007; 49(12): 4308-38. |
| [2] | Nesic S, Lee KL. A mechanistic model for carbon dioxide corrosion of mild steel in the presence of protective iron carbonate films - Part 1: A numerical experiment. Corrosion 2003; 59(6): 616-28. |
| [3] | Fang H, Wang S, Nesic S, Brown B. General CO2 corrosion in high salinity brines The 61st NACE Annual Conference Houston, Texas. 2006.2006. http://www.corrosioncenter.ohiou.edu/documents/ publications/8165.pdf |
| [4] | Nesic S, Postlethwaite J, Olsen S. An electrochemical model for prediction of corrosion of mild steel in aqueous carbon dioxide solutions. Corros Sci 1996; 52(4): 280-94. [https://doi.org/10.5006/1.3293640]. |
| [5] | Sun YH, Nesic S. A parametric study and modeling on localized CO2 corrosion in horizontal wet gas flow The 59th NACE Annual Conference New Orleans, Louisiana. 2004.2004. https://www.onepetro.org/conference-paper/NACE-04380 |
| [6] | Takabe H, Ueda M. The formation behavior of corrosion protective of low Cr bearing steels in CO2 environments The 56th NACE Annual Conference 2001.Houston, Texas. 2001. https://www.onepetro.org/conference-paper/NACE-01066 |
| [7] | Heuer JK, Stubbins JF. Microstructure analysis of coupons exposed to carbon dioxide corrosion in multiphase flow. Corrosion 1998; 54(7): 566-75. |
| [8] | Muraki T, Nose K, Asahi H. Development of 3% chromium linepipe steel The 58th NACE Annual Conference San Diego, California. 2003.2003. https://www.onepetro.org/conference-paper/NACE-03117 |
| [9] | Kermani B, Cochrane R, Dougan M, Linne C, Gonzalez J. Development of low carbon Cr-Mo steels with exceptional corrosion resistance for oilfield applications The 56th NACE Annual Conference 2001.Houston, Texas. 2001. https://www.onepetro.org/ conference-paper/ NACE-03117 |
| [10] | Hu LH, Zhang L, Chang W, Lu MX, Xu LN. Compare the corrosion resistance of 3% Cr steel with API X65 pipeline steel in CO2 corrosion environment The 66th NACE Annual Conference 2011.Houston, Texas. 2011. https://www.onepetro.org/conference- paper/NACE-03117 |
| [11] | Chen TH, Xu LN, Lu MX, Chang W, Zhang L. Study of factors affecting low Cr alloy steels in a CO2 corrosion system The 66th NACE Annual Conference Houston, Texas. 2011.2011. [https://www.onepetro.org/conference-paper/NACE-03117 |
| [12] | Xu LN, Xie Y, Lu MX, Zhang L, Chang W. Effect of temperature on wet CO2 corrosion of 3% Cr pipeline steel The 66th NACE Annual Conference Salt Lake City, Utah. 2012.2012. https://www.onepetro.org/conference-paper/NACE-2012-1348 |
| [13] | Konet RR, Honer GJ, Thompson RM. Implementation strategies for API570 injection point inspection programs The 51th NACE Annual Conference 1996.Denver, Colorado. 1996. https://www.onepetro.org/conference-paper/NACE-96588 |
| [14] | Zhang GA, Lu MX, Chai CW, Wu YS. Effect of HCO3- concentration on CO2 corrosion in oil and gas fields. J Univ Sci Technol Beijing 2006; 13(1): 44-9. |
| [15] | Kermani B, Turconi G, Perez T, Morales C, Gonzales J. In-field corrosion performance of 3% Cr steels in sweet and sour downhole production and water injection The 59th NACE Annual Conference 2004.New Orleans, Louisiana. 2004. https://www.onepetro.org/ conference-paper/ NACE-04111 |
| [16] | Takabe H, Ueda M. Corrosion resistance of low Cr bearing steel in sweet and sour environments The 57th NACE Annual Conference 2002.Denver, Colorado. 2002. https://www.onepetro.org/conference-paper/NACE-04111 |
| [17] | Wang SH, George K, Nesic S. High pressure CO2 corrosion electrochemistry and the effect of acetic acid The 59th NACE Annual Conference New Orleans, Louisiana. 2004.2004. https://www.onepetro.org/conference-paper/NACE-04375 |